# Composition
Composition analysis refers to the model dedicated to user and user property statistics. Using the model, you will be able to compare data performances of different user groups, view the number of users across the combination of different dimensions, quickly portray different user persona and comprehensively grasp the characteristics of designated user groups from multiple perspectives, thus providing evidence for refinement operation.
In Composirion analysis, you will be able to find answers to the following questions:
- What are the numbers of users from different states under the present project, and which state has the largest number of users?
- Is there any significant difference in average accumulative payment per user across different user groups?
Notes
- Only User tags or Cohorts whose entity is TE User ID or Property can be used as in the analysis.
- When selecting User tags, computation will be conducted based on the newest version of the tag, which cannot be modified.
- There is no timezone distinction between user properties and timezone cannot be displayed either.
# Rapidly configure analysis metrics
Like Event analysis, you will be able to flexibly configure analysis metrics in property analysis.
By default, the analysis metric is the number of users, that is, the distinct count of TE user IDs (#user_id) satisfying the conditions. You may also select user properties or tags to carry out statistics.
You can also conduct Data Filtering to rule out certain user data. Composition analysis supports filtering based on user property, user tag or cohort.
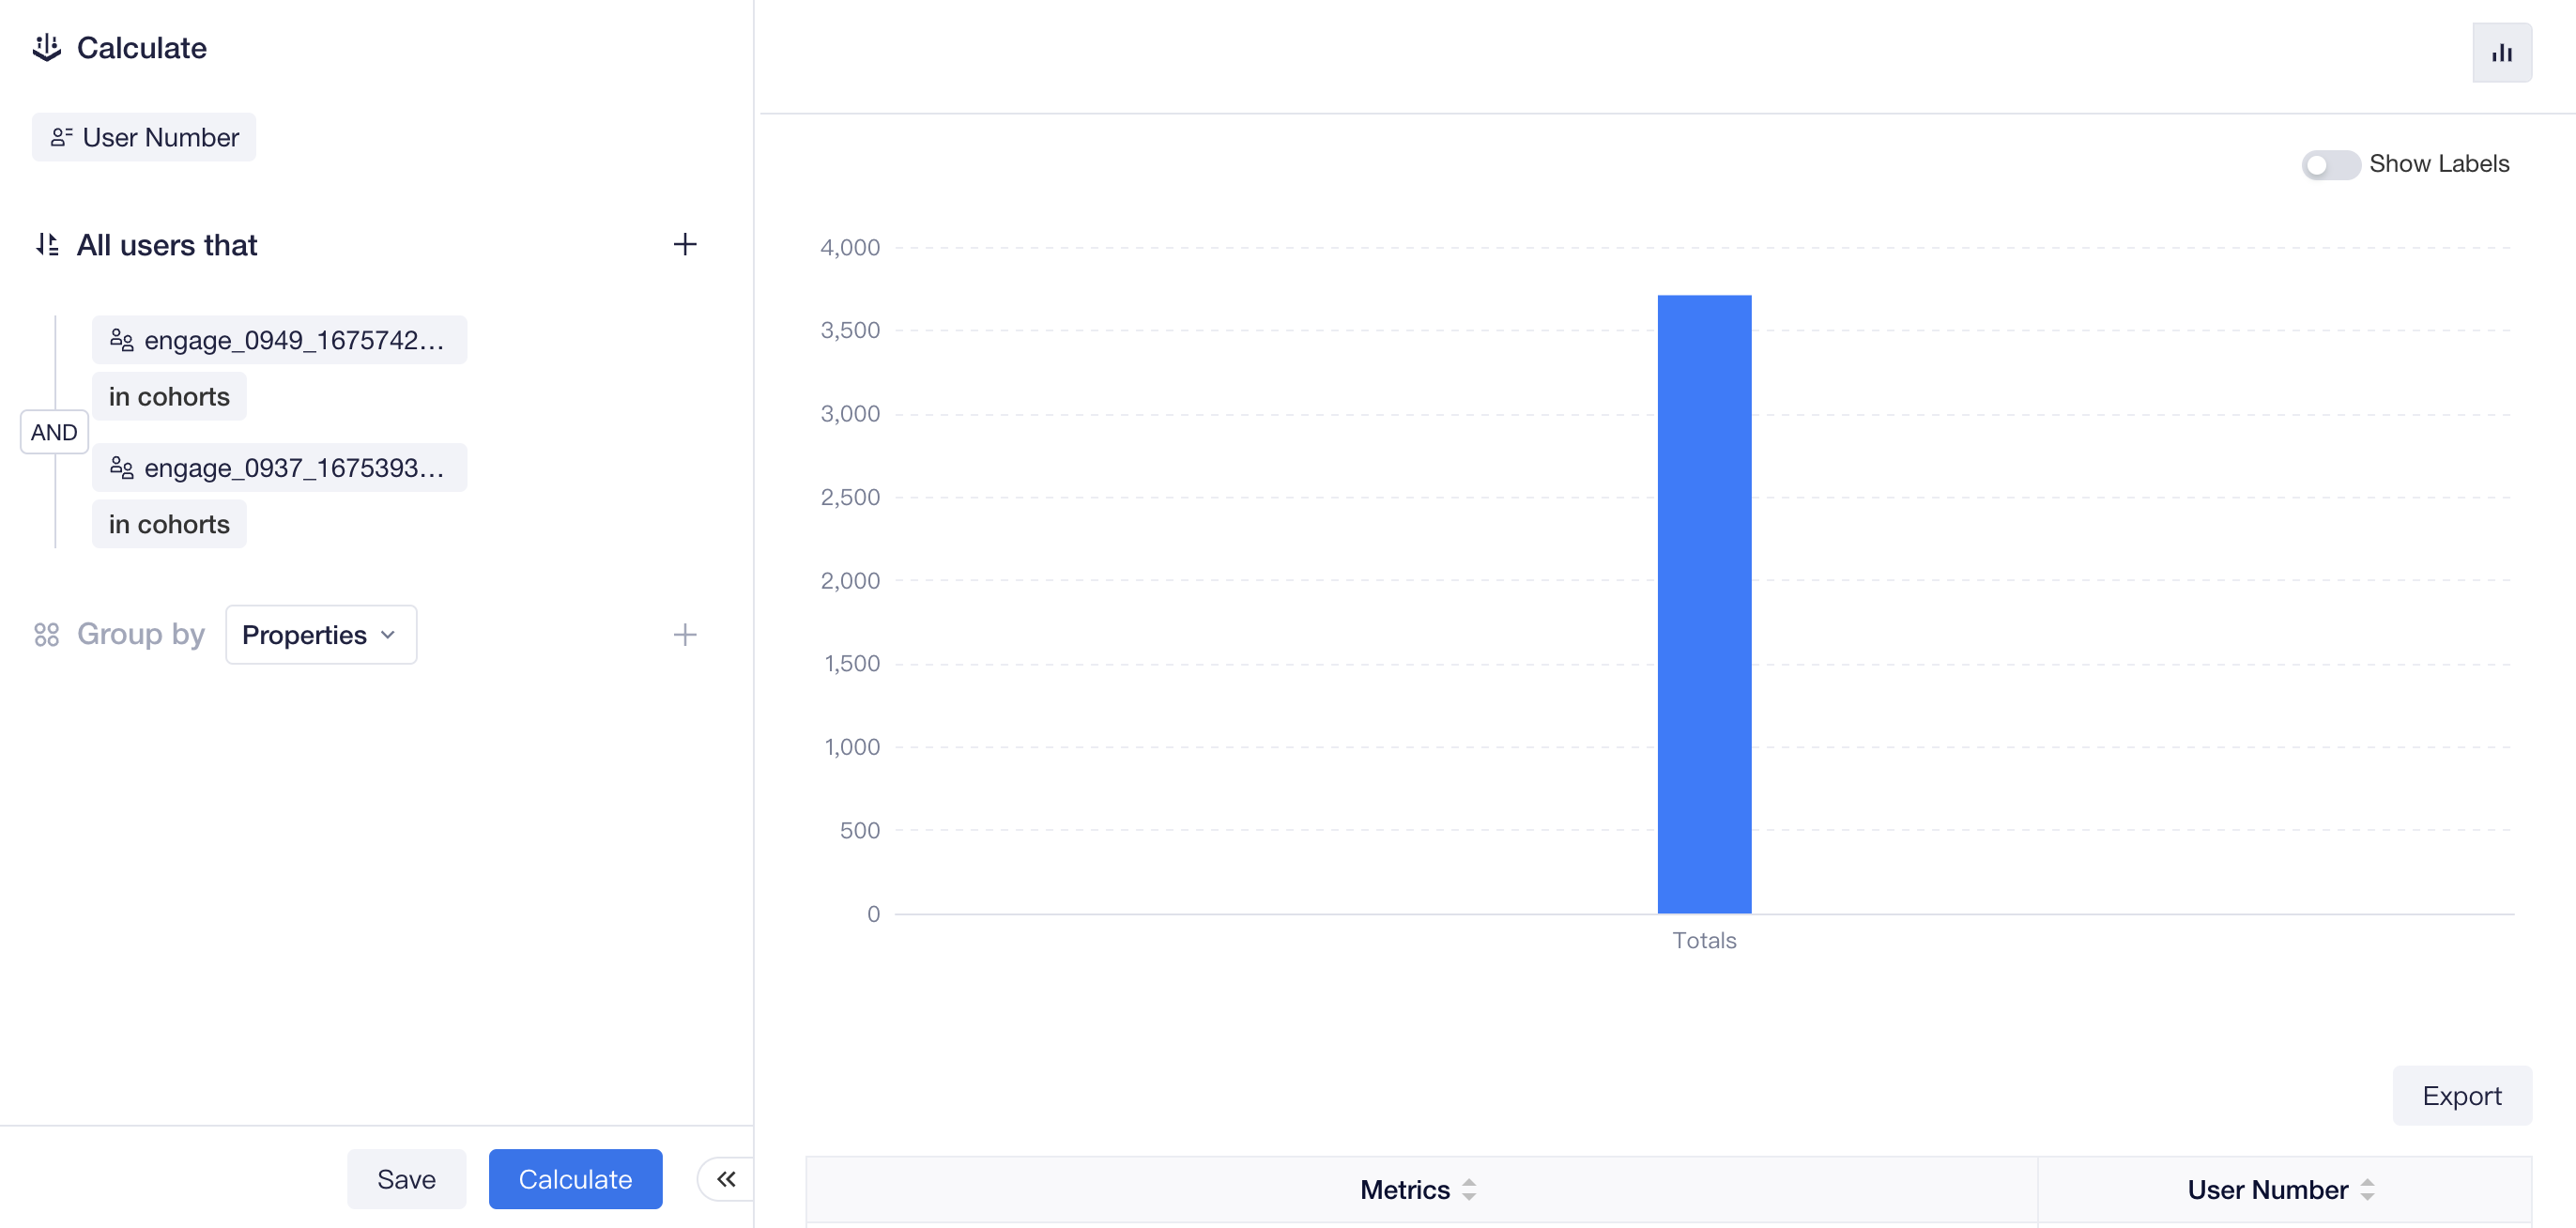
For example, if you want to find users simultaneously belonging to different cohorts, you can configure "All users that" and drill down to the User List to view detailed information or save this batch of users as result cohort and obtain a use set containing multiple cohorts.
# Group statistics by property
When carrying out group statistics by property, you can select a maximum of two group-by items.
- Select a single group-by item
After selecting a single group-by item, you can intuitively view the number of users across different groups or data of other analysis metrics.
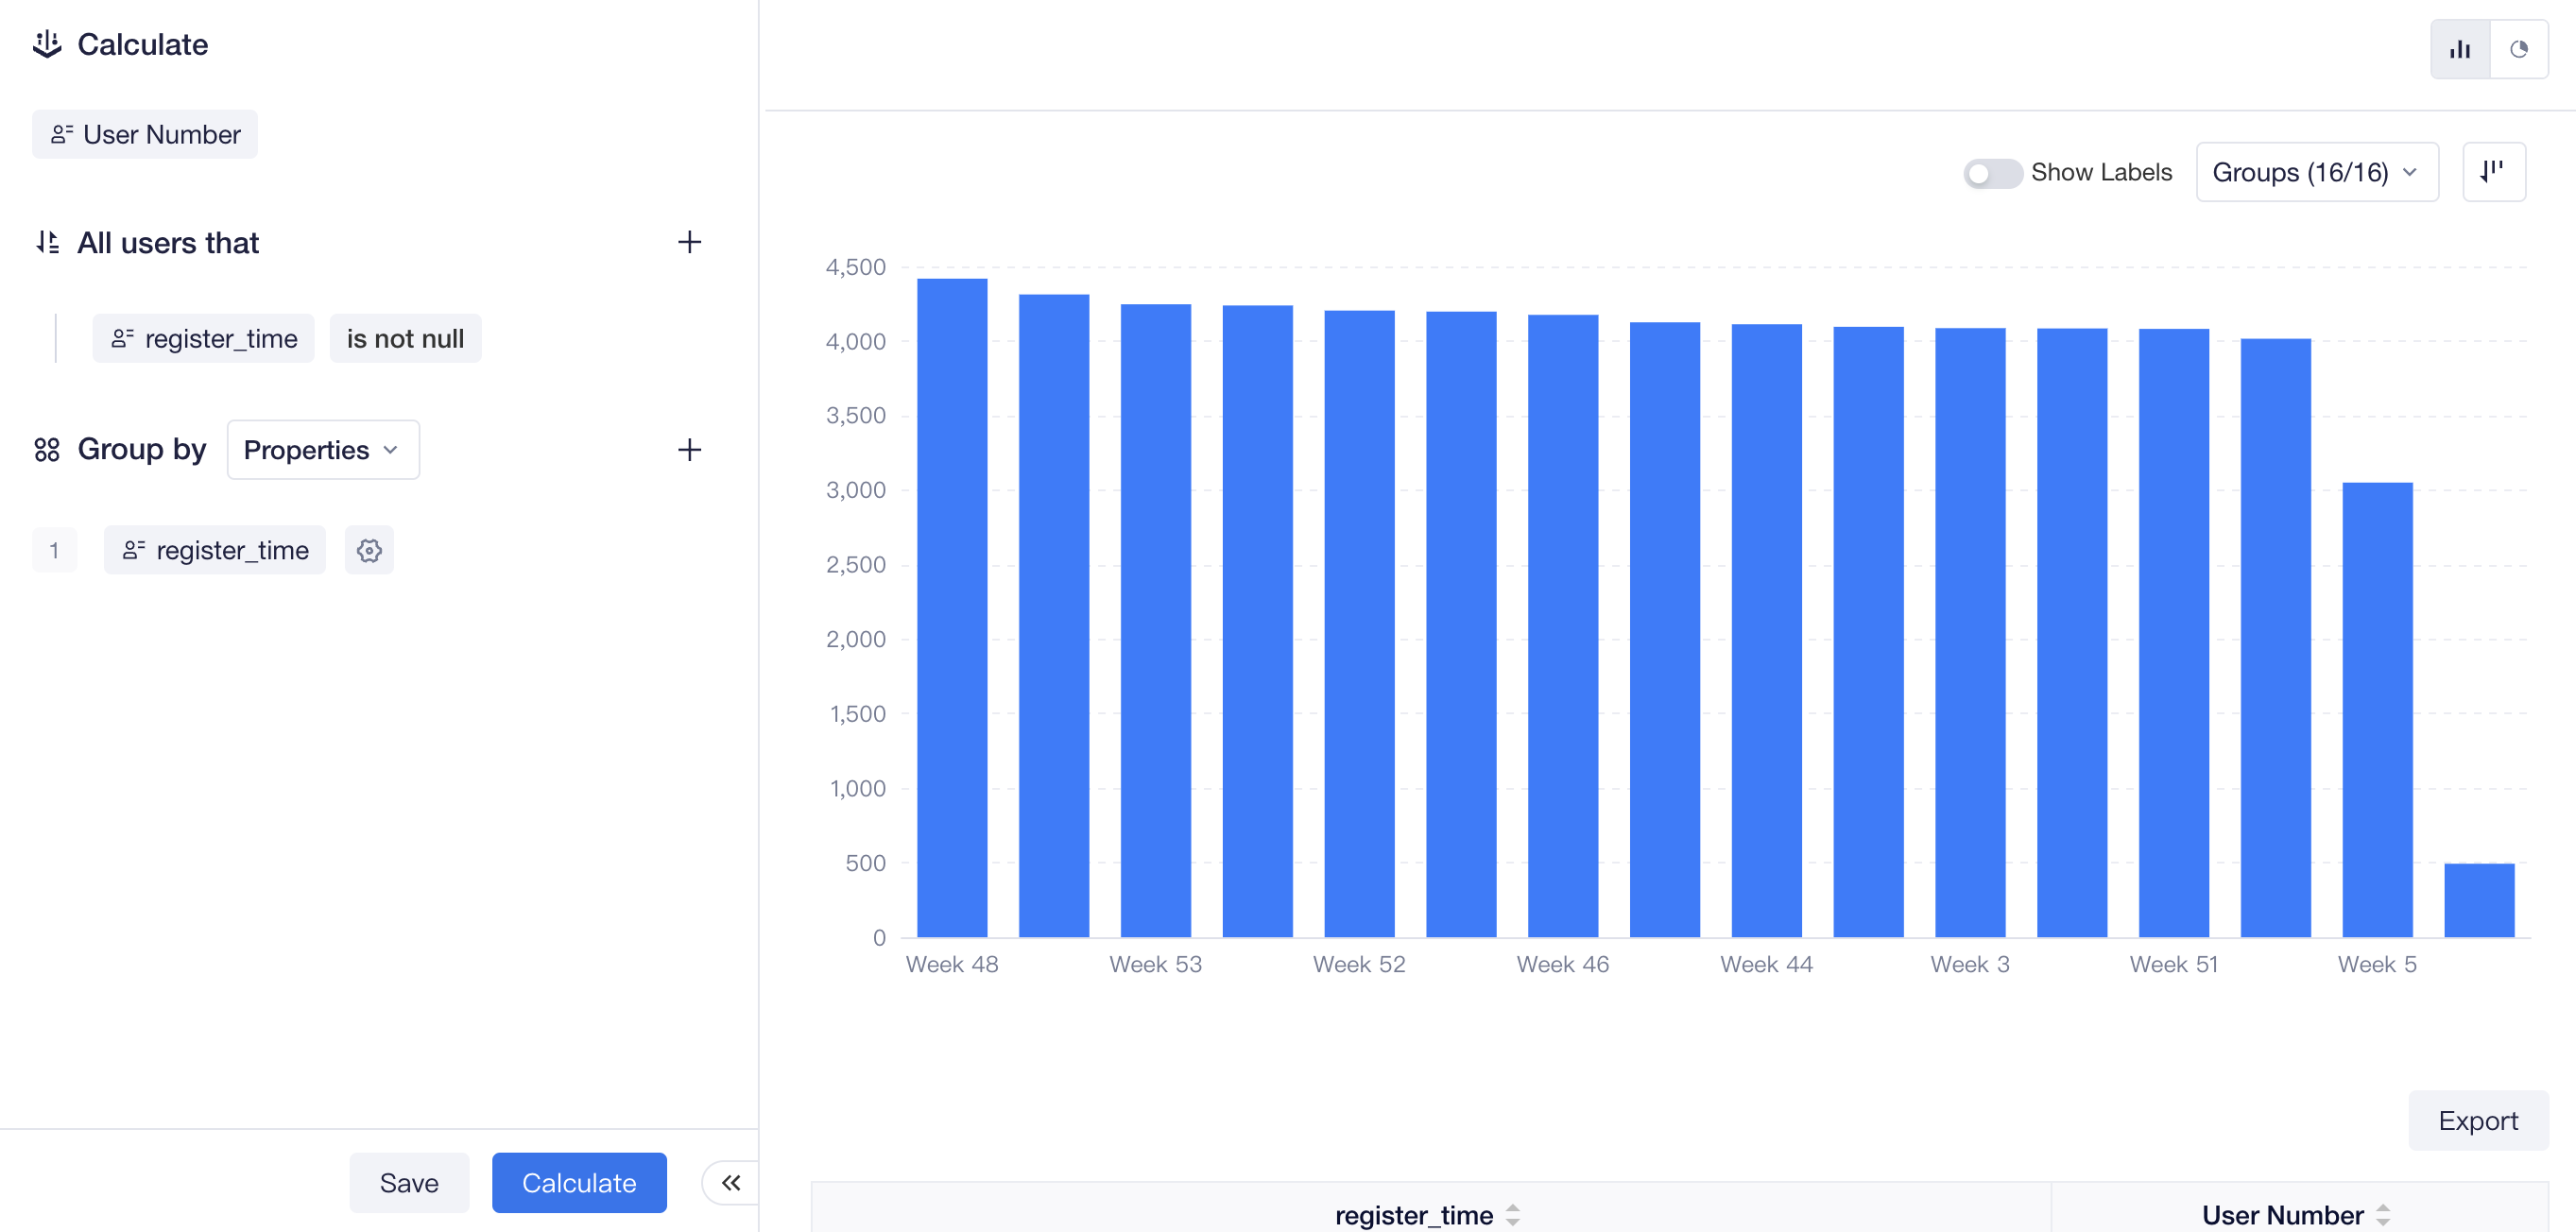
For example, if you select registrater time as the group-by item and the user number as analysis metric, then you can view the number of daily/weekly/monthly registered users in Bar or view their percentages in the Pie chart.
- Select two group-by items
When selecting two group-by items, the columnar distribution of data will be presented in the form of stacked plot. You may view the plot by selecting one of the group-by items as the X-axis.
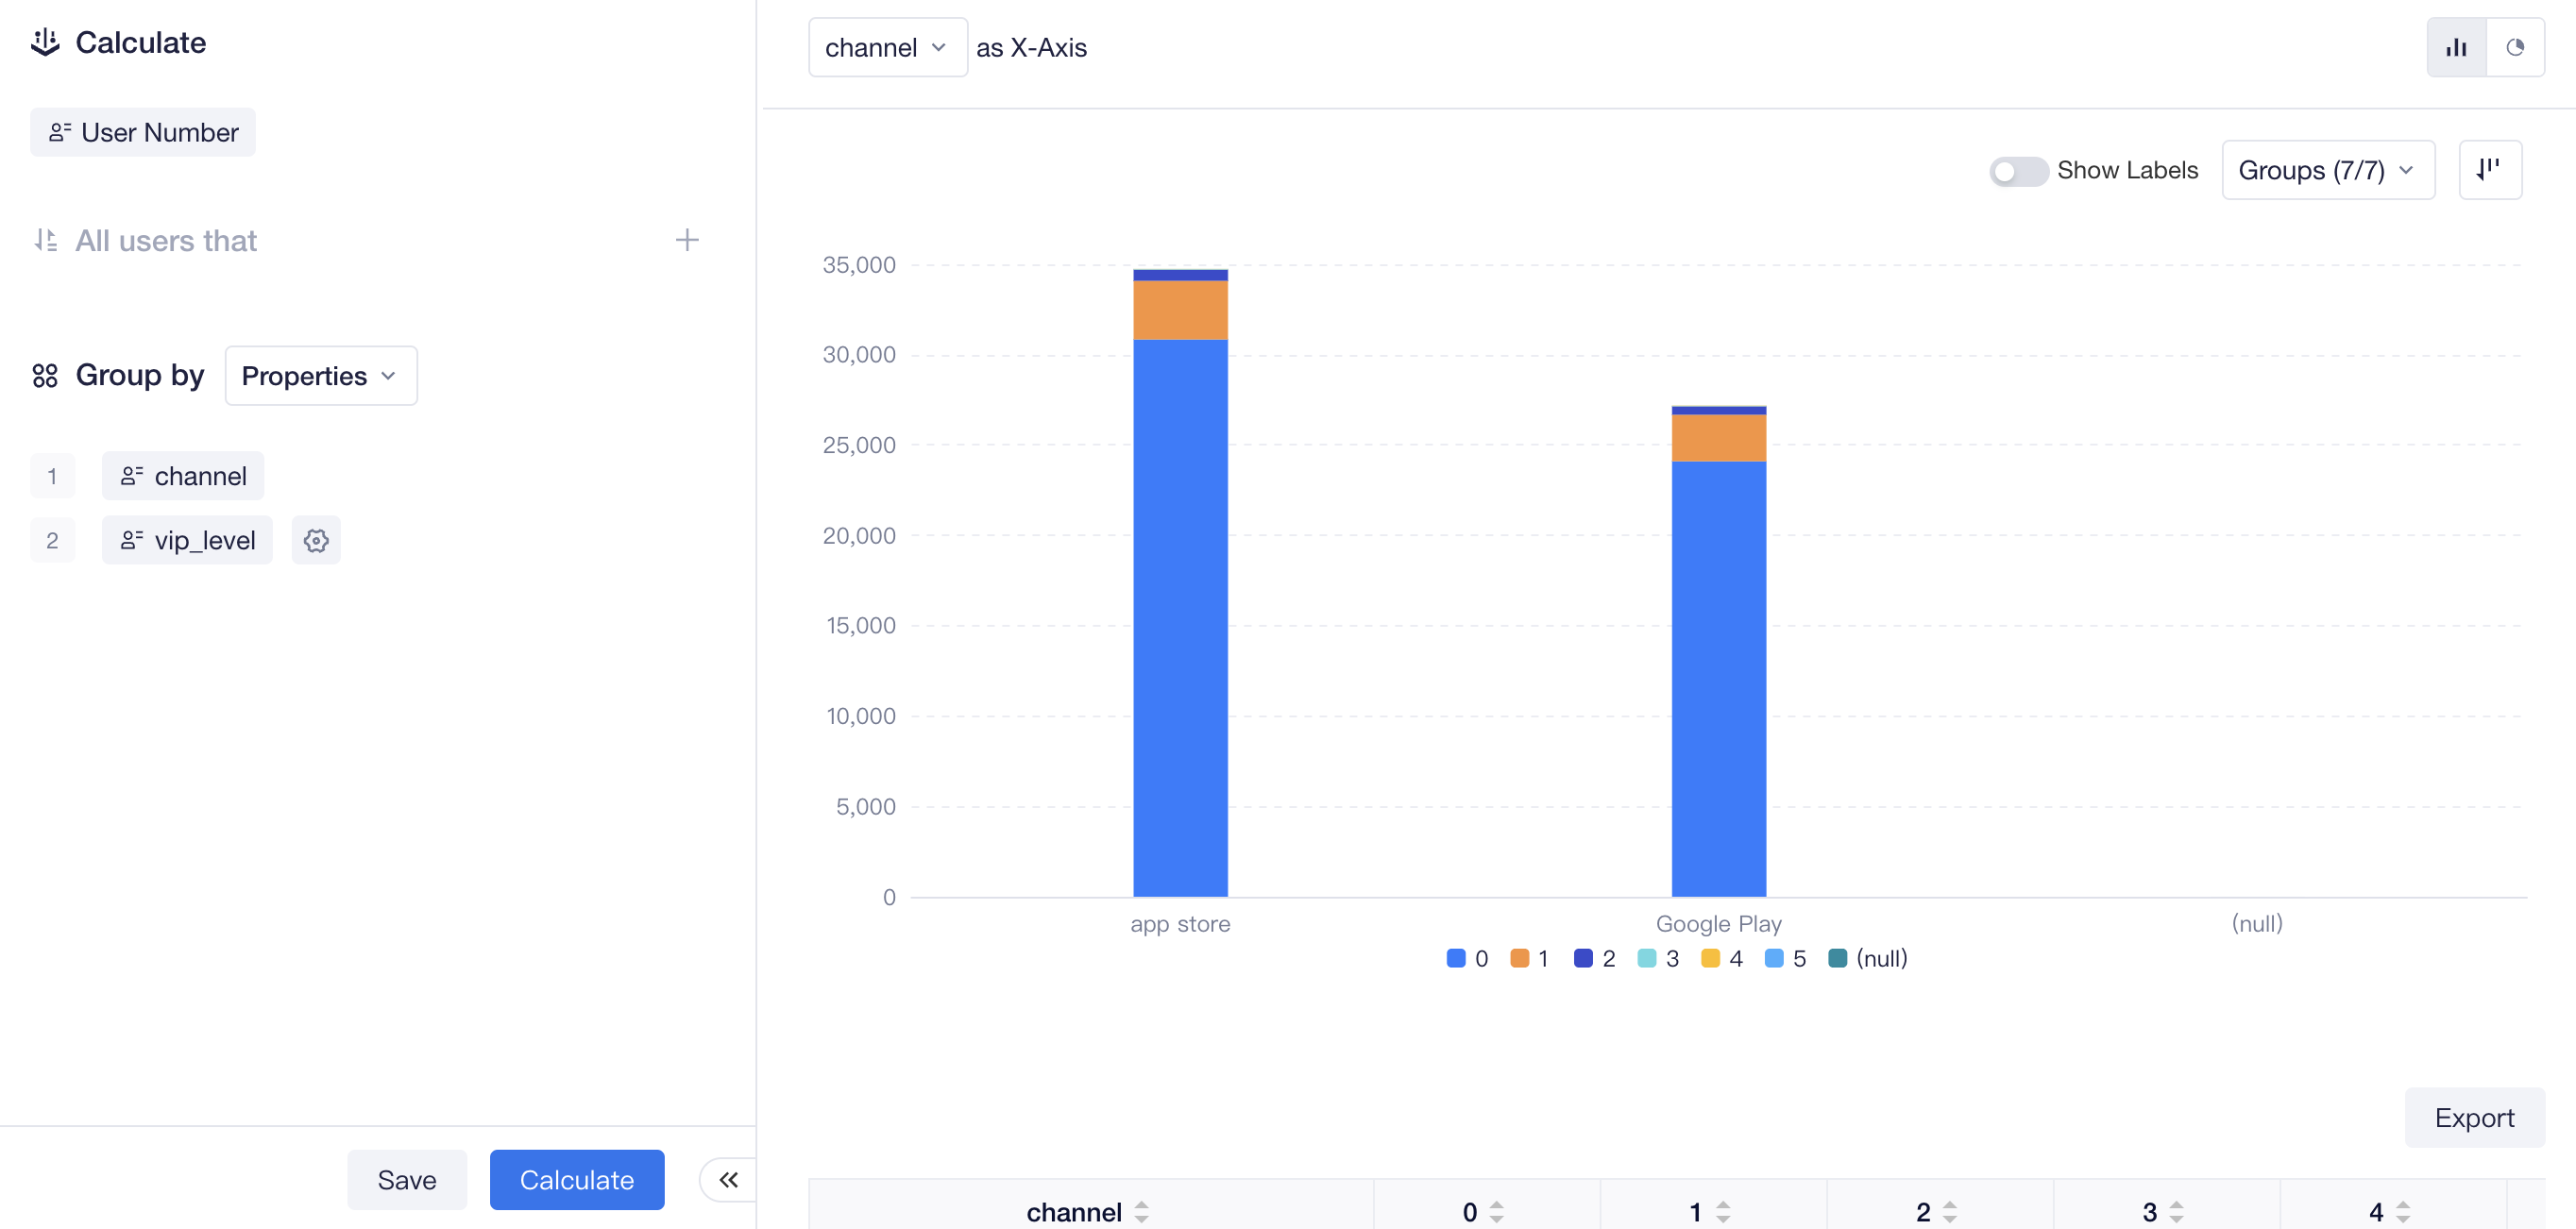
The two group-by items are respectively displayed as the row and column headers in the table. Each cell shows the data of analysis metric of crossed dimensions to facilitate you to quickly identify the correlation between different group-by items or compare data results of different groups.
# Compare data performances of different user groups
Unlike other models, composition analysis also supports comparing data performances of different user groups, such as the number of users, user average or variance of cumulative payment, except group-by items. A maximum of 10 user groups can be compared.
Apart from selecting cohorts that have been created, you can also filter by user properties or tags and customize a user group satisfying the definition or select "All Users" as the control group.
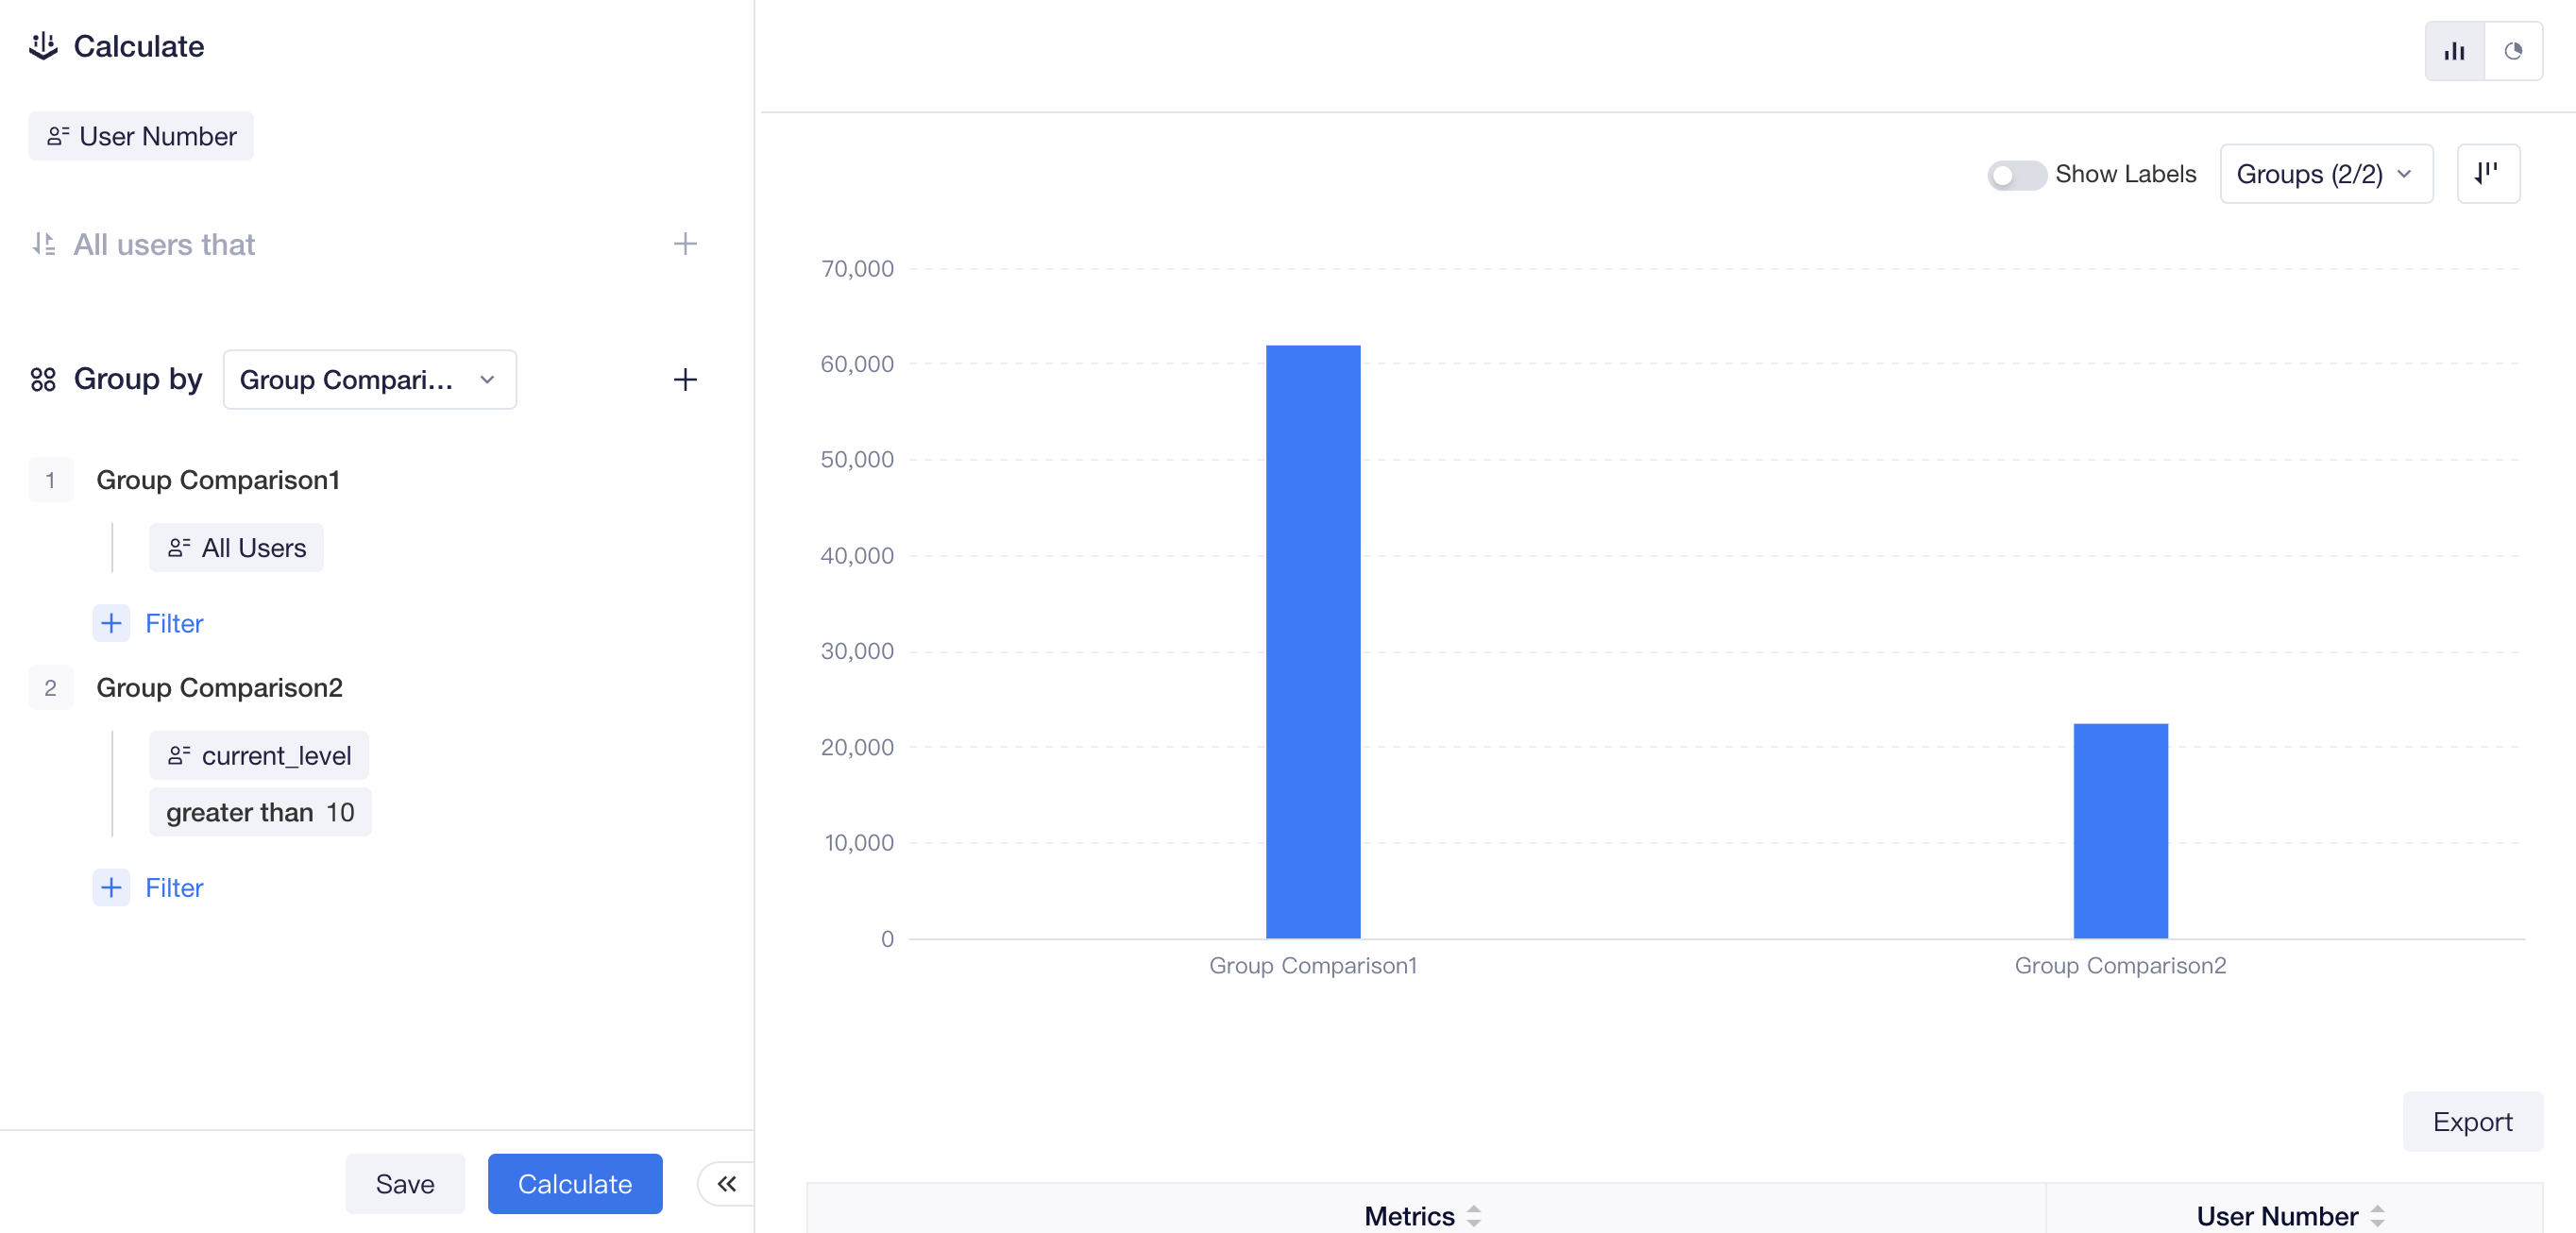
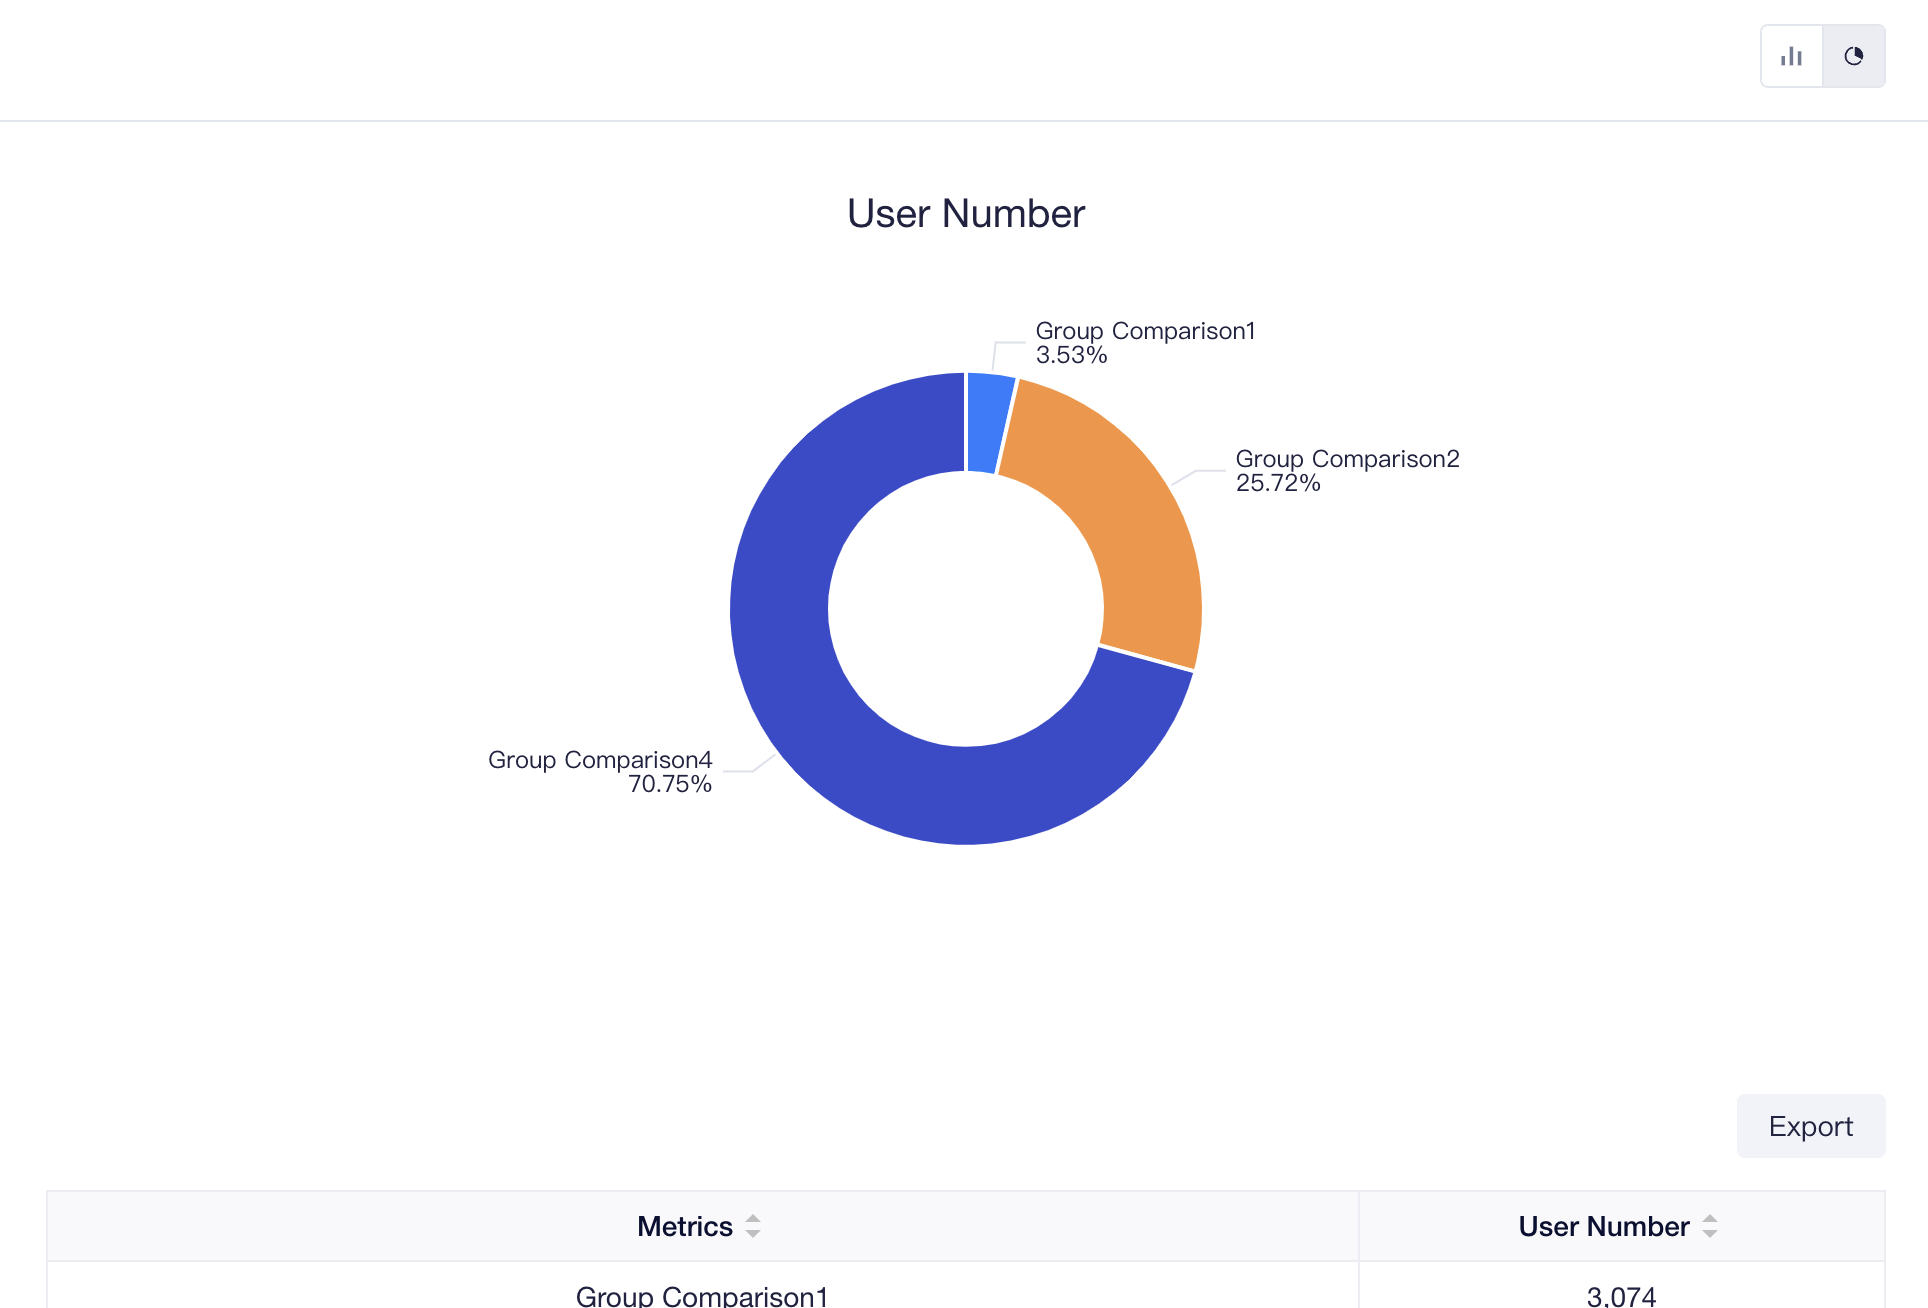
In the chart display area on the right, you can also intuitively compare analysis metrics of different user groups through Bar chart or view the percentages of different user groups through Pie chart.
← Flows Attribution →