# Interval
Interval analysis can be used to analyze the time interval between two events. It can be used to understand the occurrence frequency of a key behavior or as a complement to funnel analysis. Apart from analyzing conversion rate between different steps, interval analysis also facilitates you to understand duration of conversion in a more detailed manner.
In Interval analysis, you will be able to find answers to the following questions:
- What is the average interval between user registration and initial payment?
- The time spent between opening the application to actually accessing it is exceptional. Is there any problem with the installation package of a certain channel?
- How much should a user spend on the first chapter before entering the subsequent chapters?
# Statistical logic of intervals
Before analyzing event interval, you should first understand the computational logic of intervals.
- If you want to analyze the interval between different events, such as the interval between registration and first payment, the model will adopt the "shortest interval" principle to compute the interval. That is, for several starting events, the last one will be picked in computation, and, in the same vein, the first ending event appearing subsequently will be picked.
For example, if a user's behavioral sequence is A1 -> A2 -> B1 -> B2, then only one interval A2 -> B1 will be recognized; if the user's behavioral sequence is A1 -> B1 -> A2 -> B2, then two intervals, namely A1 -> B1 and A2 -> B2, will be recognized.
- If you want to analyze the interval of identical events, such as the median interval of two consecutive payment events of a user, then any two of the consequent events will generate an interval. That is, N events will generate N-1 intervals.
For example, if a user's behavioral sequence is A1 -> A2 -> A3 -> A4, then three intervals will be generated: A1 -> A2, A2 -> A3 and A3 -> A4.
# Configure interval events
In interval analysis, you need to select the entity, starting event and ending event and an interval is recognized only when a user entity has successively completed the first and last events.
You also need to set the upper limit of an interval, which could range from 180 days (180*24h) to 1 minute. After computing all interval data, interval analysis will rule out those exceeding the upper limit. If you are uncertain of what an appropriate upper limit should be, you can make necessary adjustments while viewing interval statistics to find an optimal interval.
To obtain an interval more suited to the statistical caliber, you may also "Hold Property Constant" to select the properties to be used respectively for the starting and ending events. The types of these properties must be consistent. After configuration, users are not only required to complete the starting and ending events in a successive fashion, but the property values of these events should be exactly the same. Events with a null property value will not be computed.
If you select numerical properties, you can also set the difference between property values. For example, when analyzing the retention of an episode, the starting and ending events are both set to be passing the episode and it is required that the association property value of the ending event is 1 higher than that of the starting event. In this instant, you will be able to obtain a conversion duration from Step1 -> Step2 -> ..., ruling out the effect of repeated passing of a same episode on the analysis.
You may also conduct Data Filtering and Group by process.
# View interval statistics
Two types of interval analysis plots are available for selection depending on your purpose of analysis.
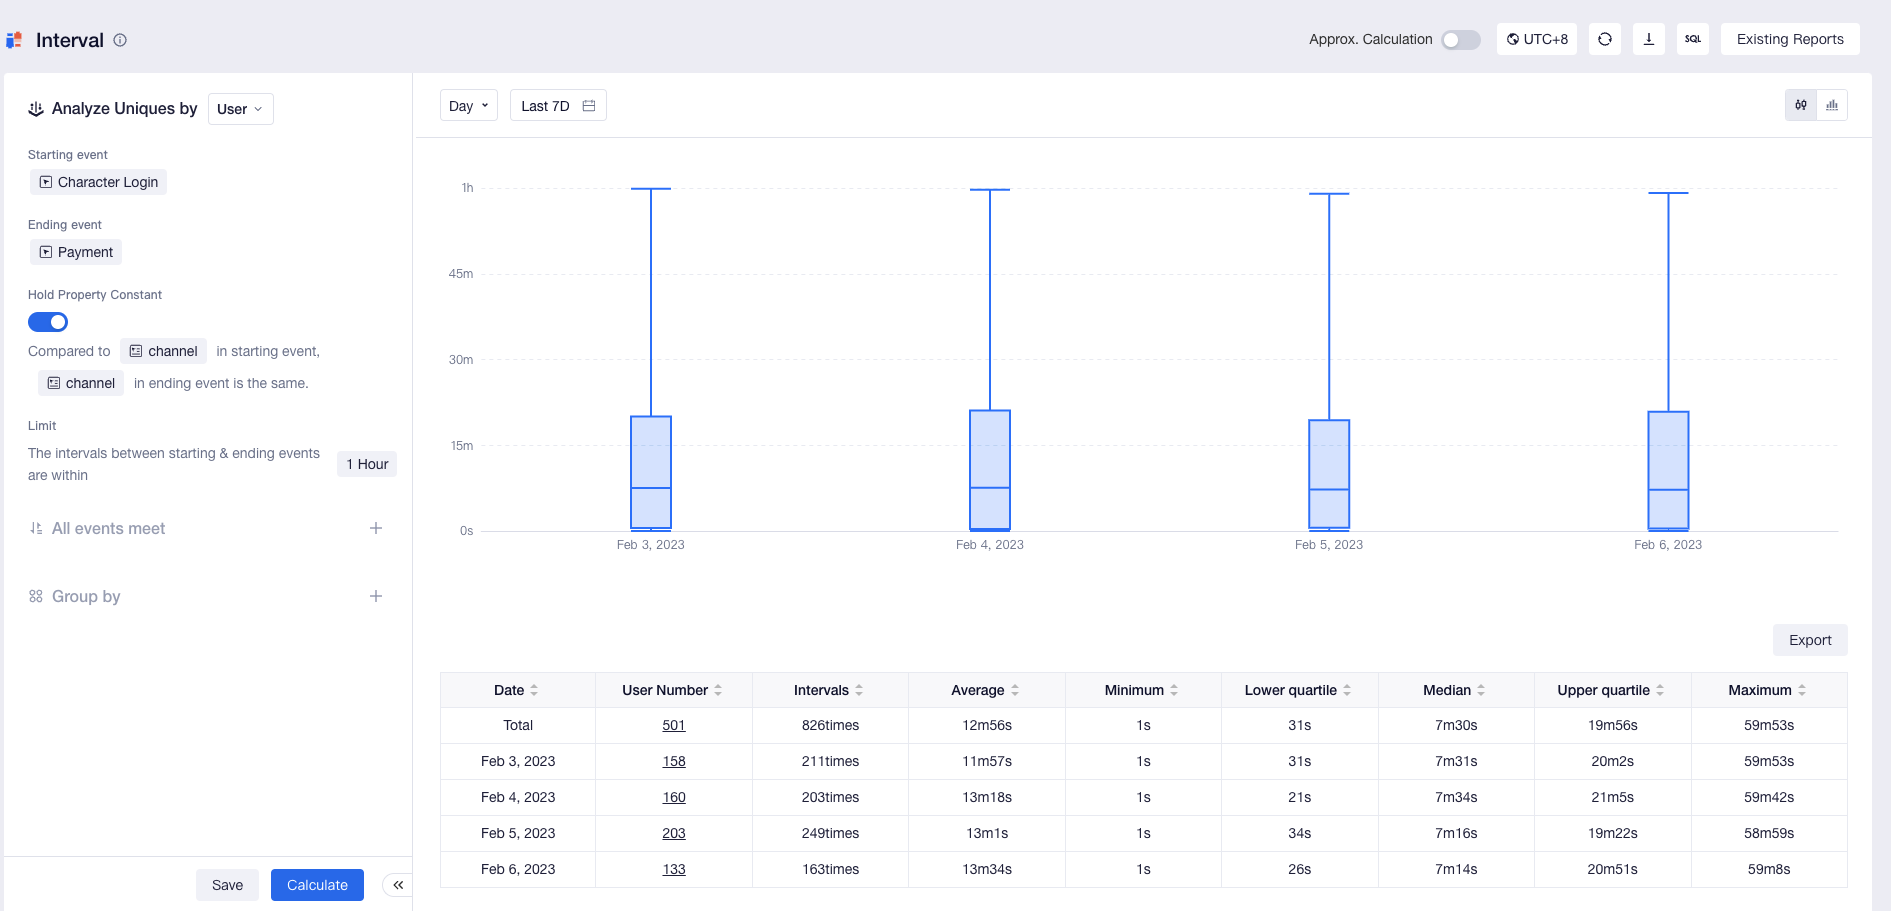
- Box-plot
You can select box-plot presentation if you want to view aggregated statistics of event intervals such as maximum value, upper quartile, median, lower quartile and minimum value. If the selected granularity of date is not total, the box-plot will display statistics varying by date.
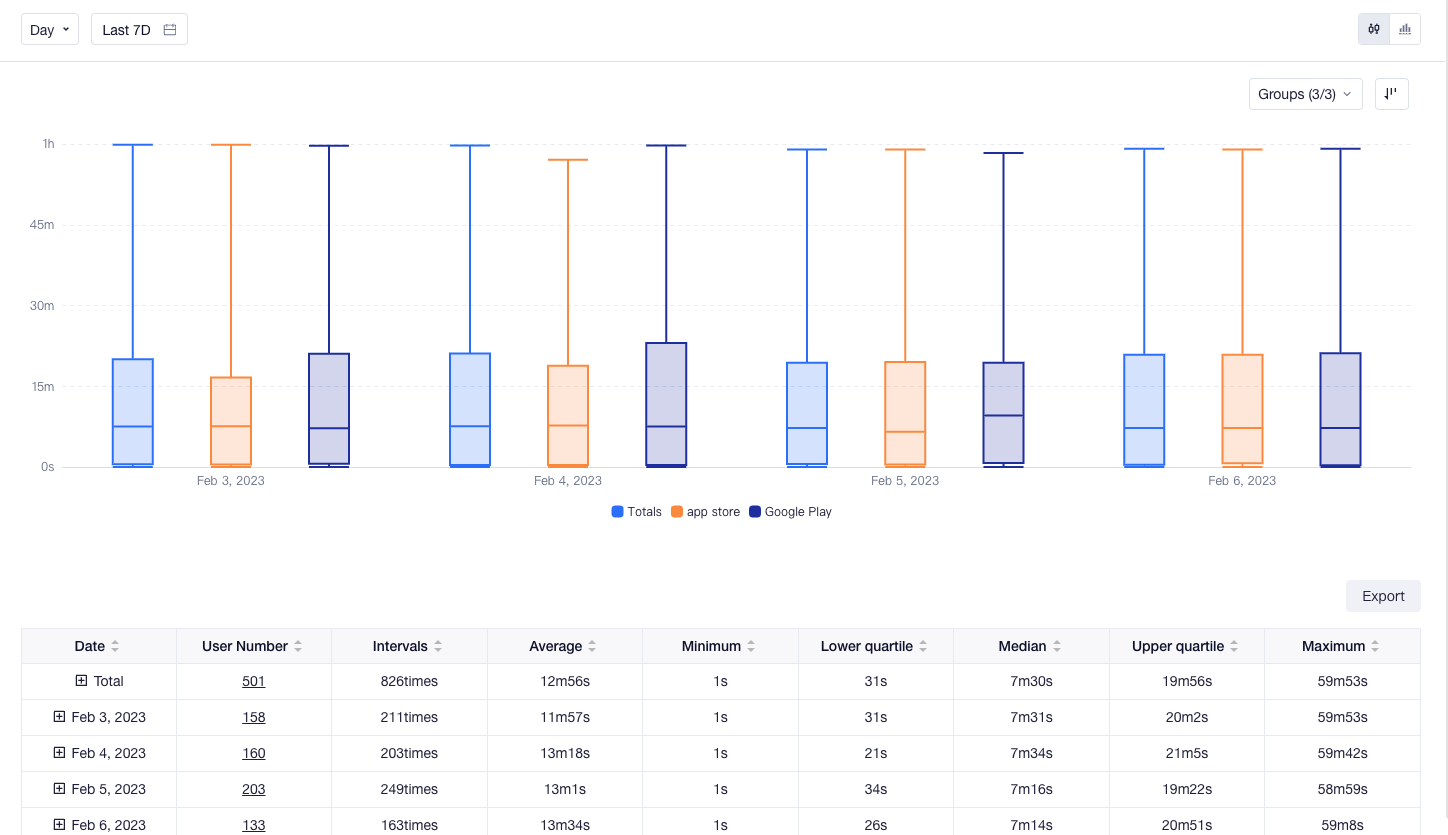
Apart from the aforementioned metrics, the table also displays metrics like the number of users, times and mean values. You may click Number of Users to access the User List, where you can view detailed information about these entities.

Additionally, you can select the percentile metrics you wish to display in the table. The percentile options include but are not limited to the options in the box-plot chart.
- Histogram
You can select histogram presentation if you want to view distributional statistics of event intervals.
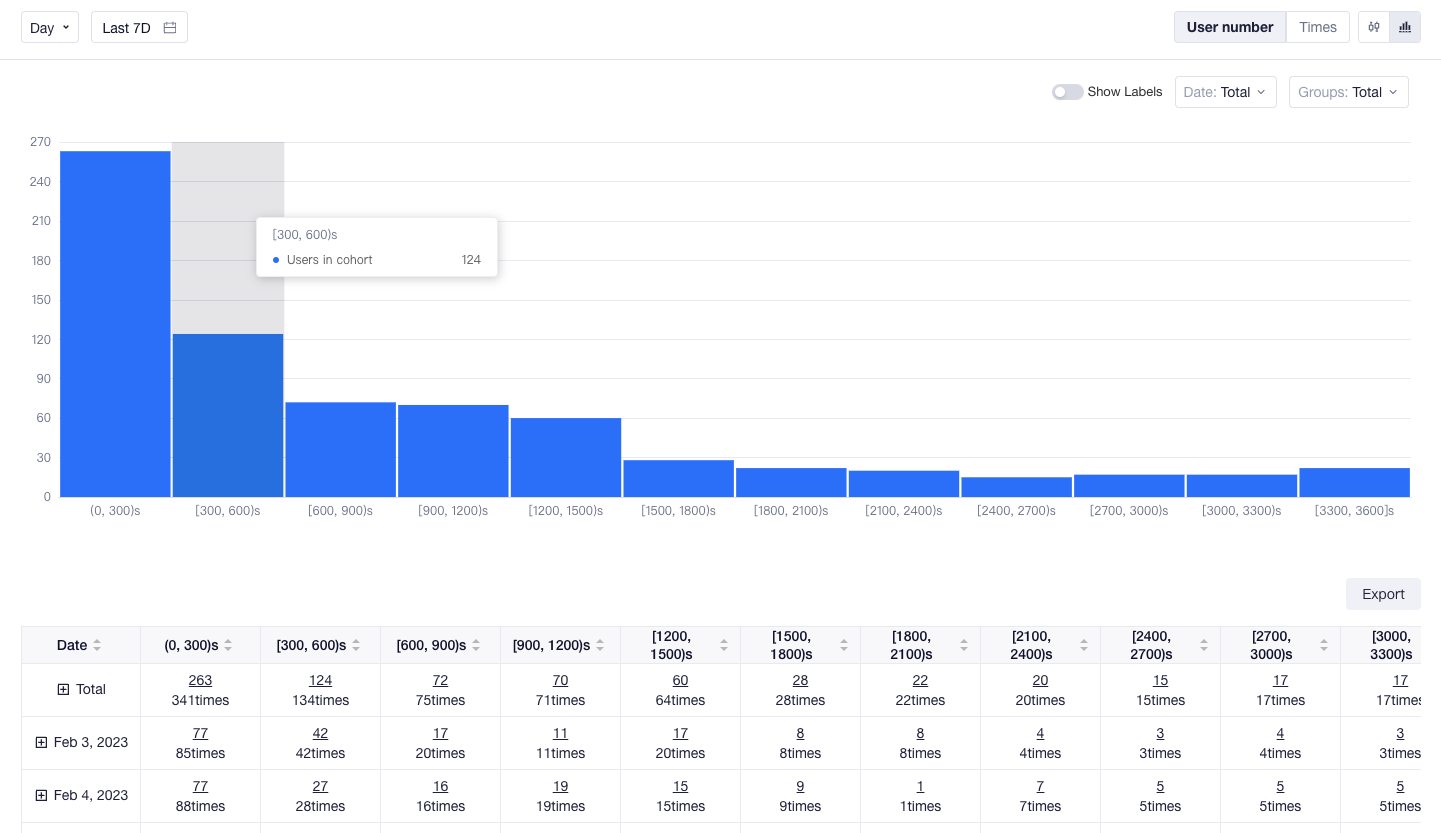
By default, the model will equally divide the space into 12 ranges and display the number of users, or the number of intervals in each range. You can customize the number of ranges through 'Interval Settings.'
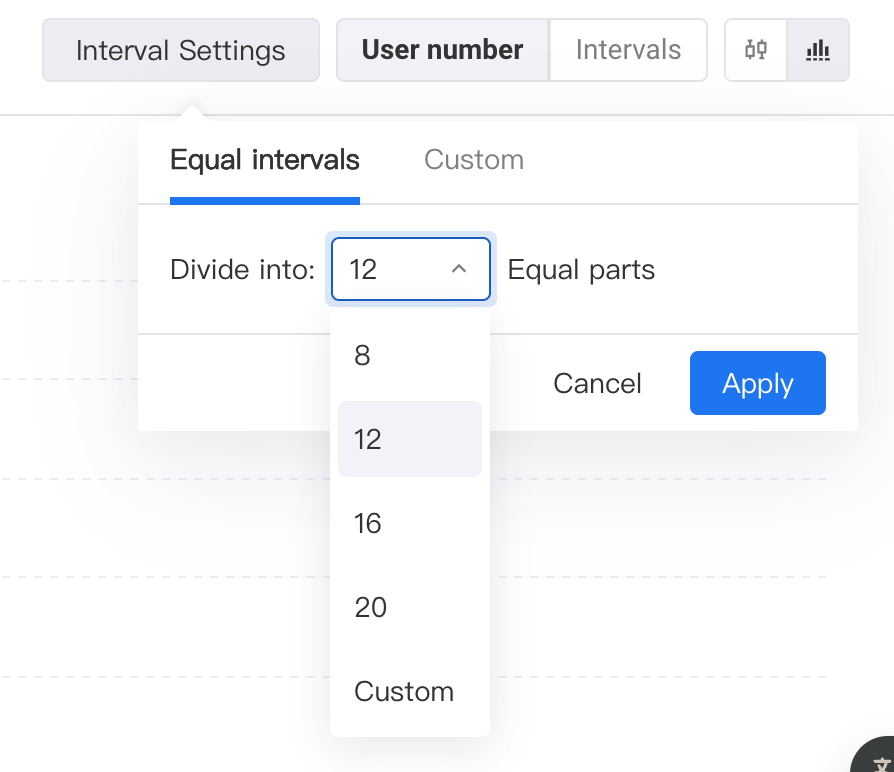
The model supports dividing into 2-30 equal intervals. You may enter the number of intervals in Custom.
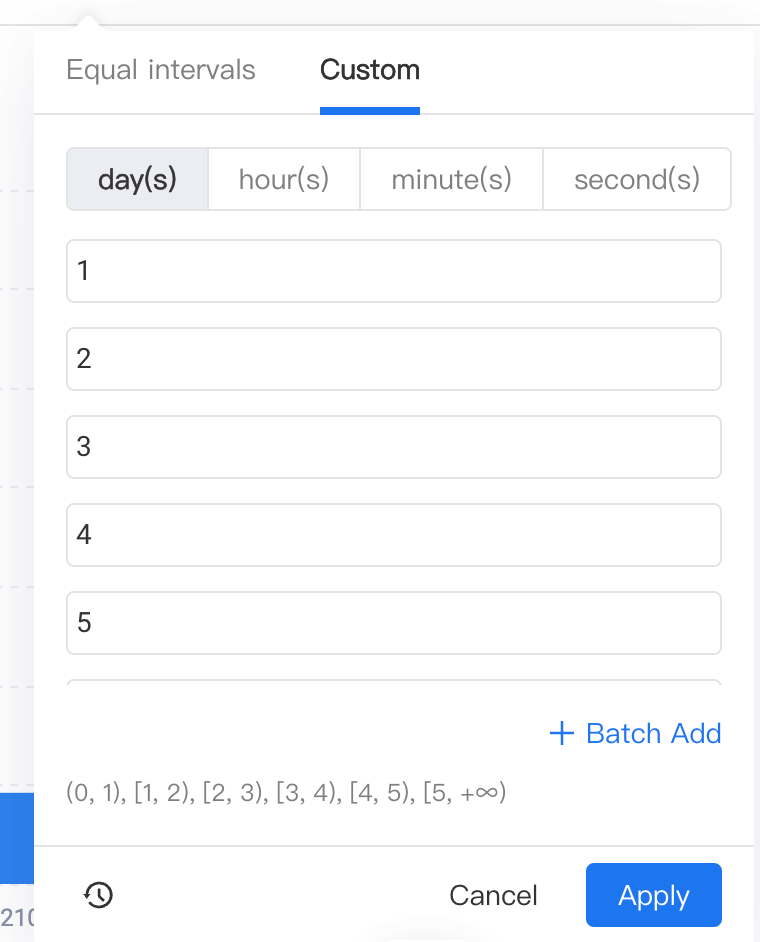
Besides equal parts, you can also set unequal intervals in 'Custom'. First, select the unit of your intervals, which can be days, hours, minutes, and seconds. Then, set the left and right ends of your intervals, you can view the interval expression below the settings area. You may also add multiple custom intervals with 'Batch Add', or see the last few entries of custom intervals in 'history'.
Please note that the interval settings will not affect and are not affected by your query settings, which means you may have intervals that have no results due to your query settings.
Like box-plot, you can also quickly view data performances of each group on the table or the detailed information of entities in exceptional ranges.
← Funnel Distribution →