# Distribution
Distribution analysis performs statistical aggregation by the number of times, days and additionally, event properties that an event is completed by entities, and divides statistics into different ranges to facilitate viewers to understand the number and proportions of users in each range.
In Distribution analysis, you will be able to find answers to the following questions:
- What are respectively the ratio of the ranges of users' login days in the last month?
- How many users have had their accumulative payment exceeding $1,000 since the launch of the server?
- Is a certain virtual currency acquired or consumed healthily? Is there any stockpiled currency that needs to be consumed in a timely manner?
# Configure entities and user perform events
The distribution analysis model aggregates data based on entities and performs statistics of how each user entity has participated in an event. You may select to perform the statistics based on the number of times, days, hours or properties of a certain event. Or you may also use equations as statistical caliber.
For example, you can conduct statistics by the number of days users logged in last week, divide the number of days into different ranges. For example, users who logged in for more than 4 days are regarded as highly active users, and view the number and percentage of these users. It should be noted that the user will be incorporated into the scope of statistics only if the user indeed triggered selected event. A user who has not logged in during the last week will not be incorporated into any range.
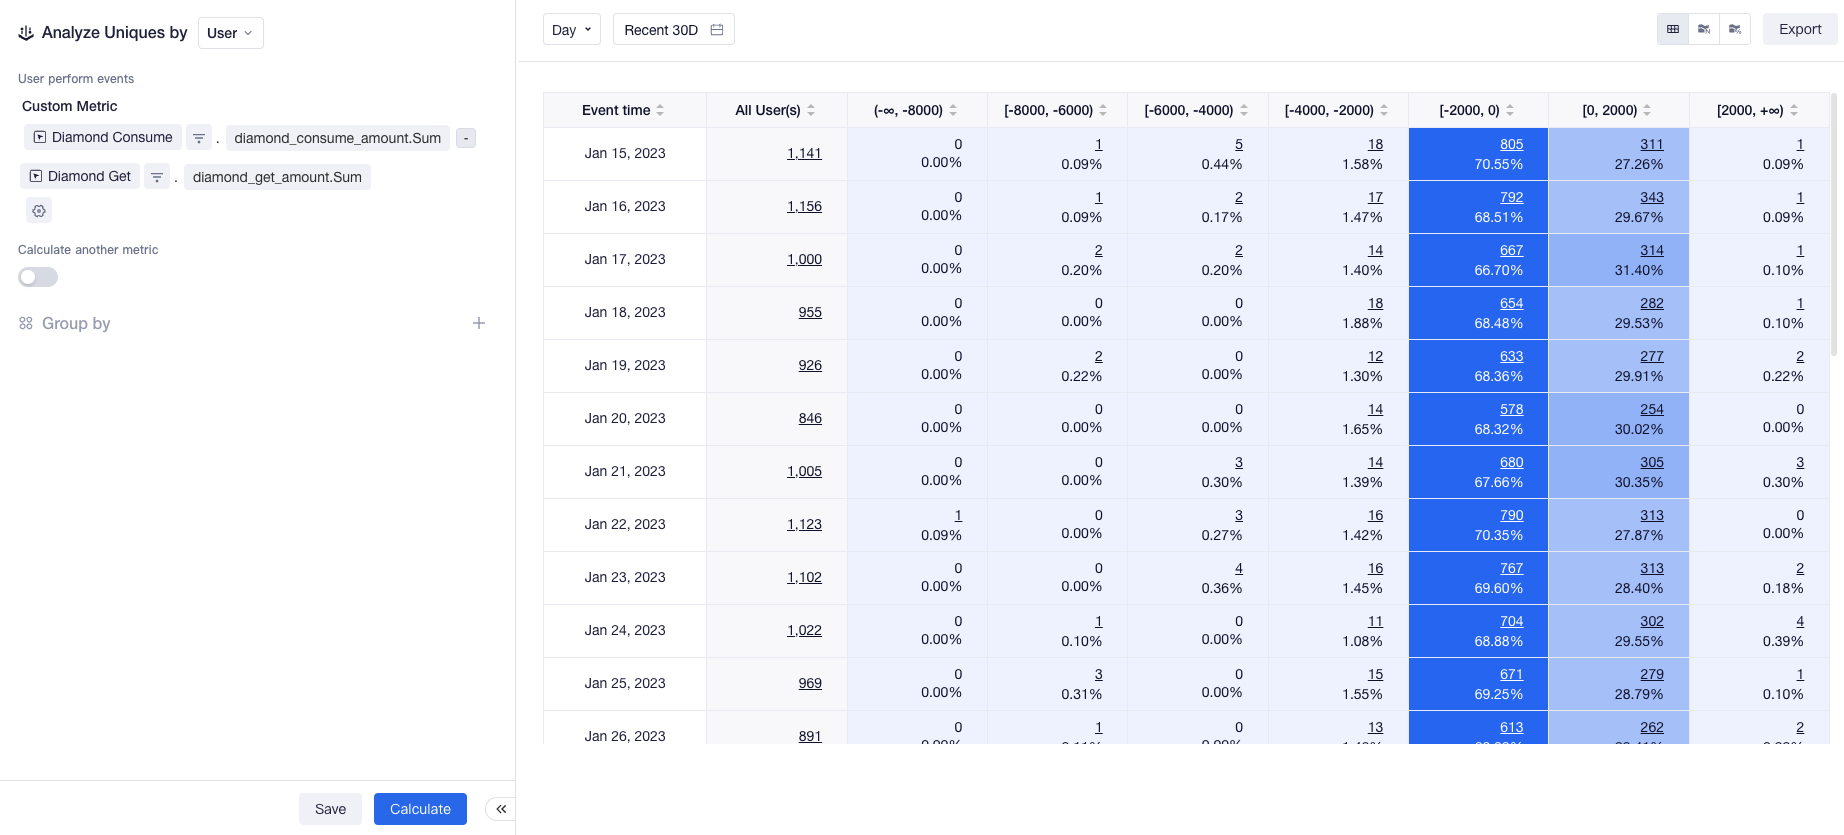
Here is another example, if you want to analyze the stock of each user's diamonds to determine whether the production and consumption of the virtual currency is balanced. You can set the following equation to obtain the stock of diamonds: number of diamonds acquired - number of diamonds consumed. Then, you can divide the statistics into different ranges based on the stocks and view relevant ratios.
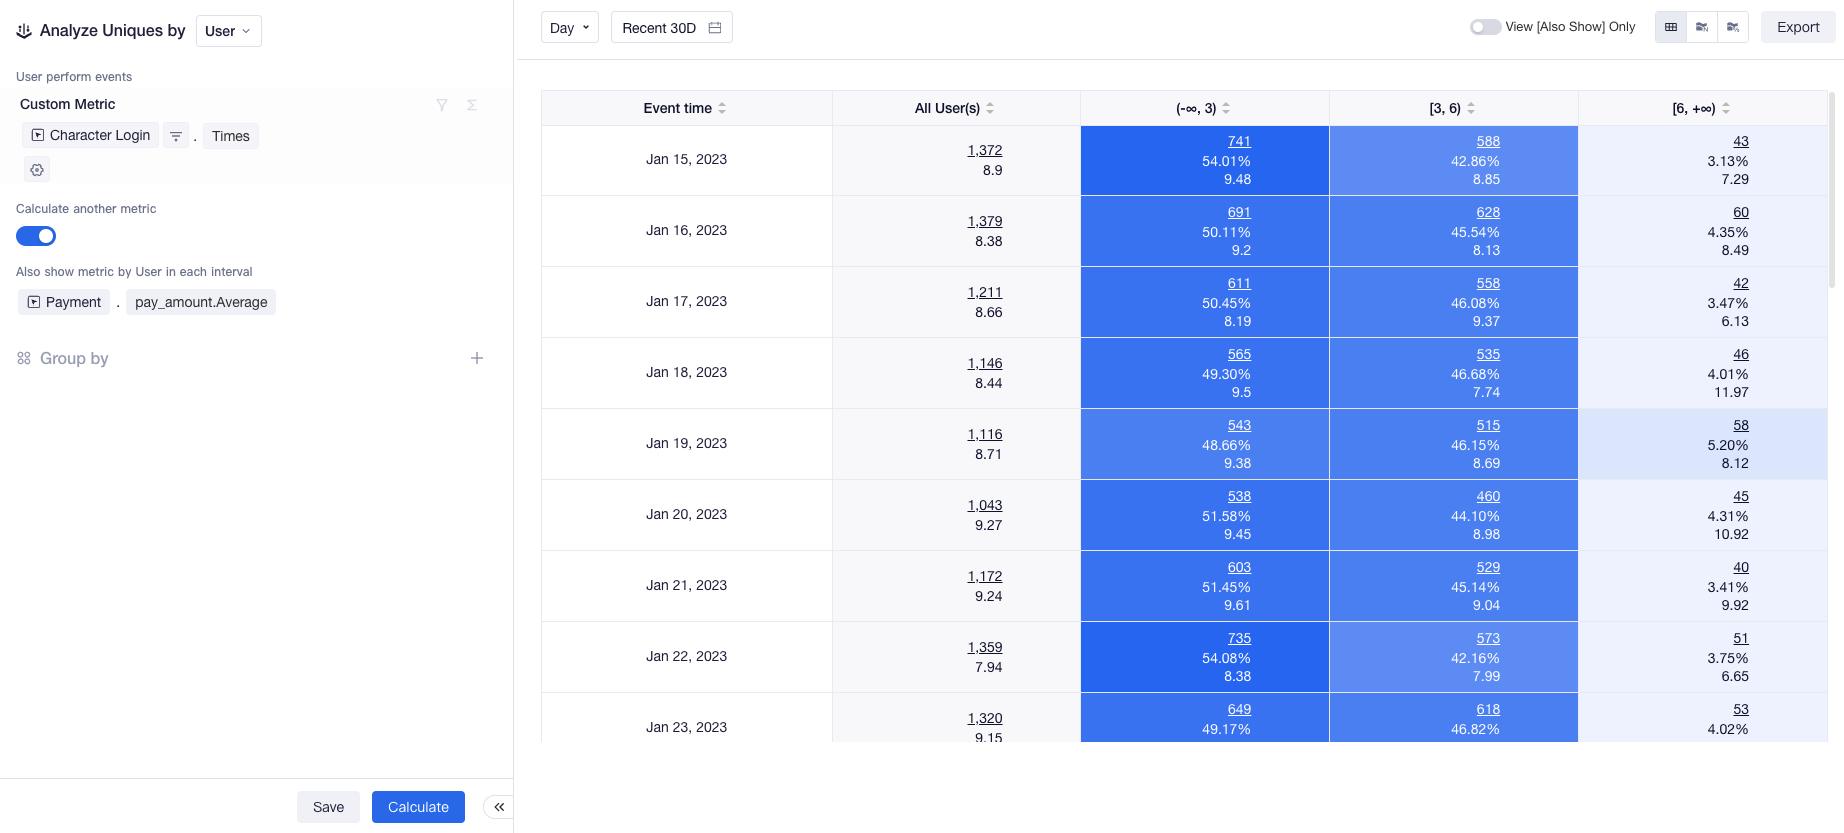
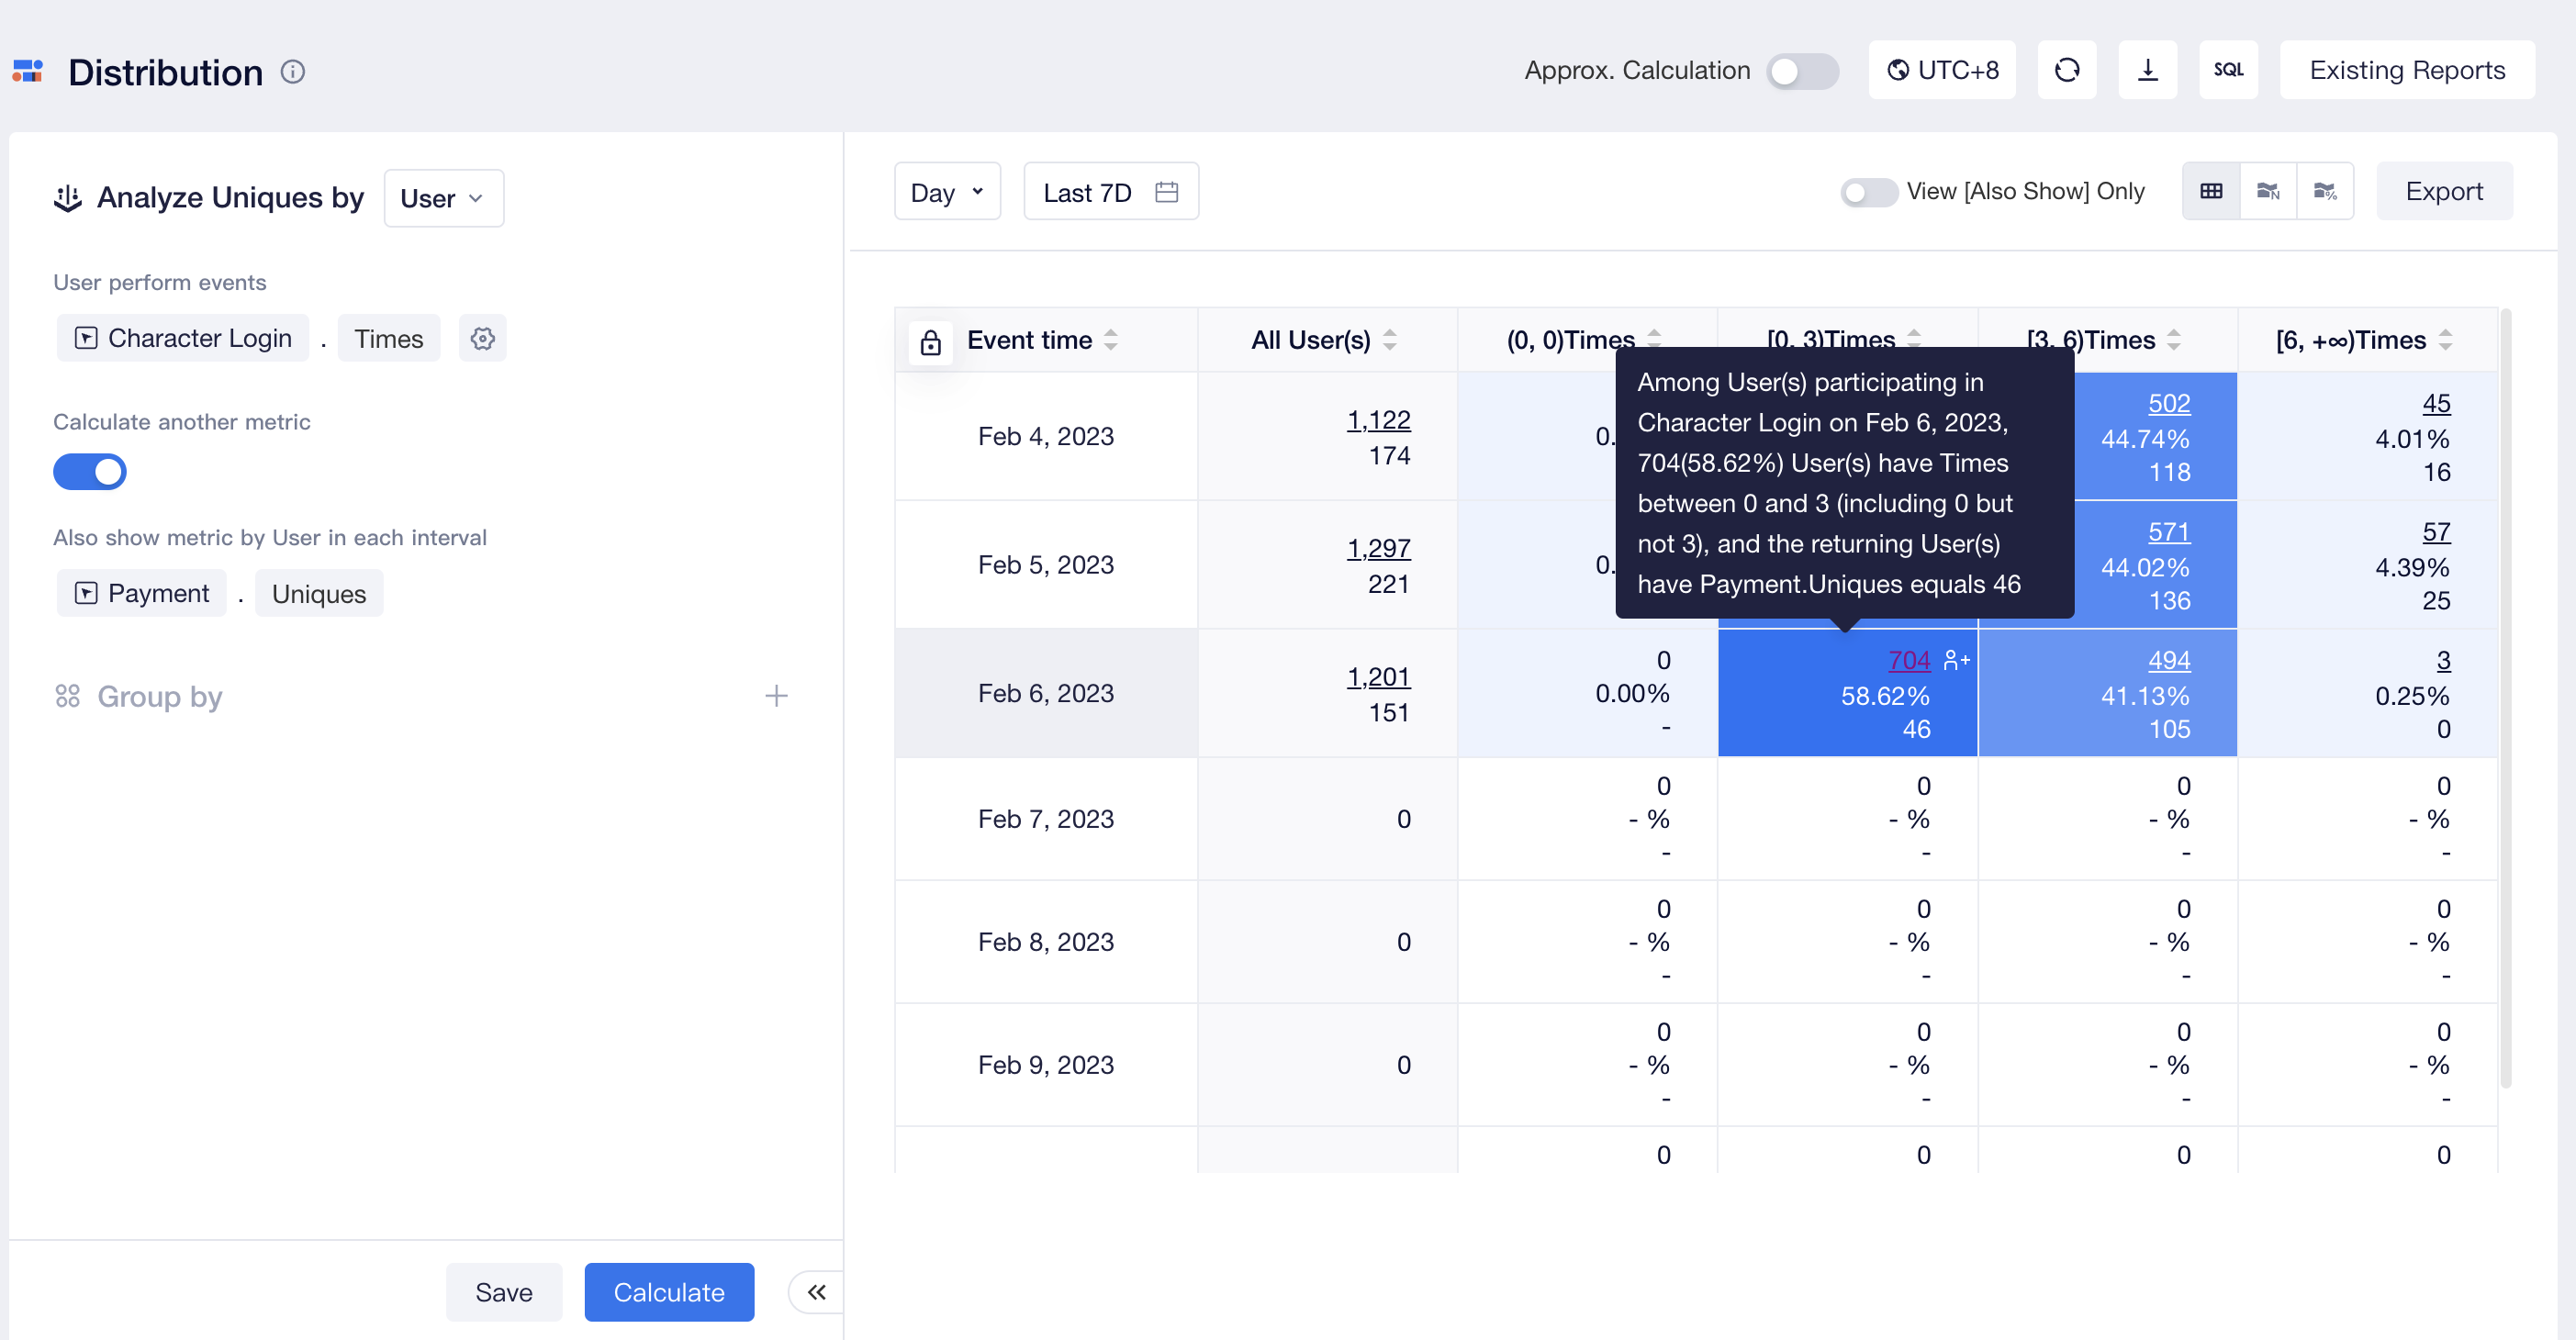
If you want to carry out further analysis on users within a certain range, you can enable "Calculate another metric" to display "Also Show" metric. Distribution analysis will compute this metric based on user event data (namely, event analysis metrics of these users) within these ranges.
For instance, you can divide users into low, medium and high active levels by the number of days they log in, and configure payment amount as the Also Show metric to rapidly compare payments of users across different active levels.
Like other models, you may also conduct Data Filtering and Group by process.
# Display distribution by charts
By default, Distribution analysis presents detailed data in the form of tables. You can view data like the number of entities, ratios and Also Show metrics of all users and those in each range from the table. You may also click User List or save the data as result cohort. You can view detailed statistical caliber when you move the mouse cursor in a cell.
If you want to view the number of users in each range, you can select the following types of charts:
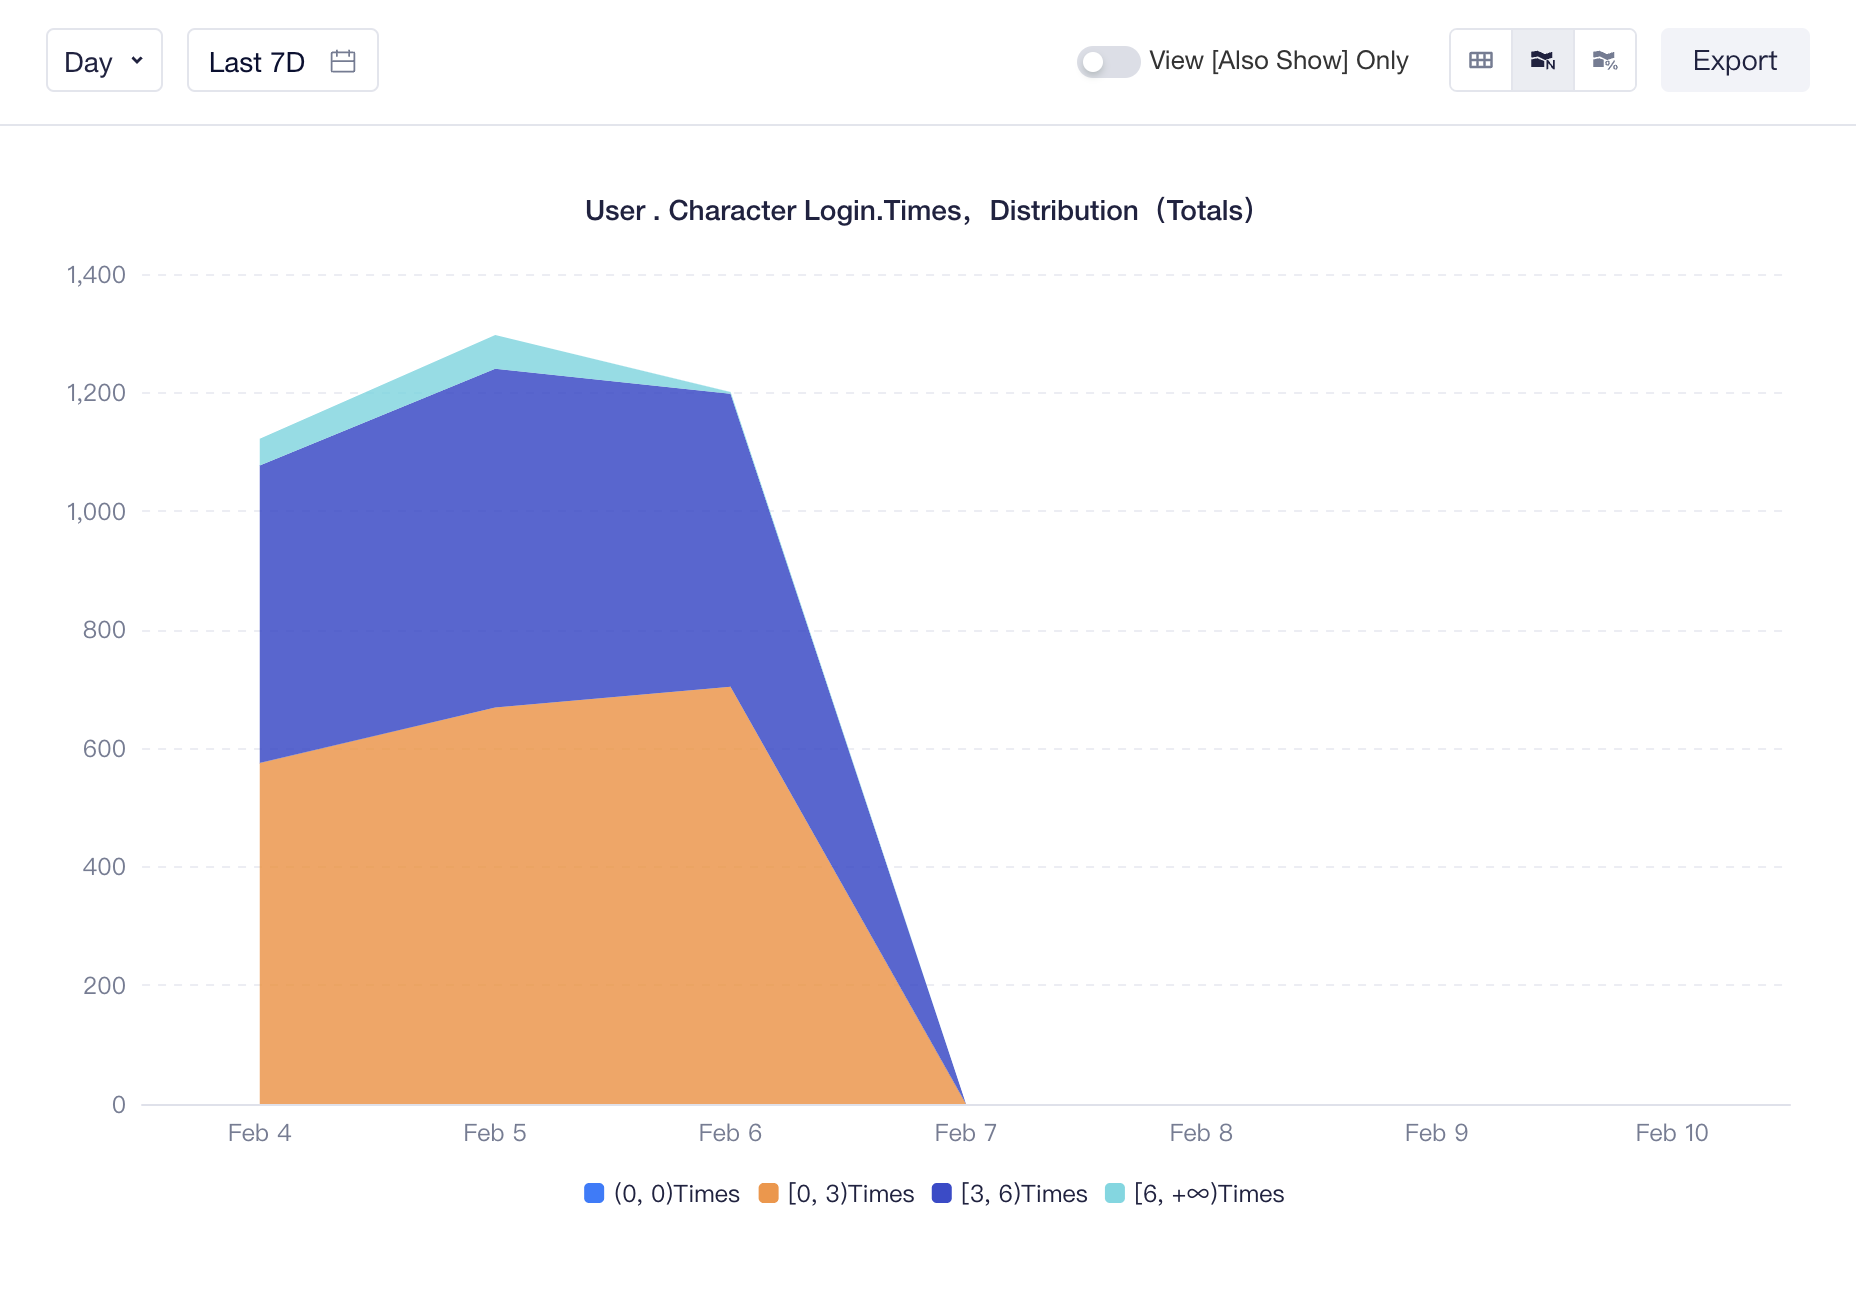
- Stacked Distribution
Stacked Distribution shows the trend of the number of users in each range by date.
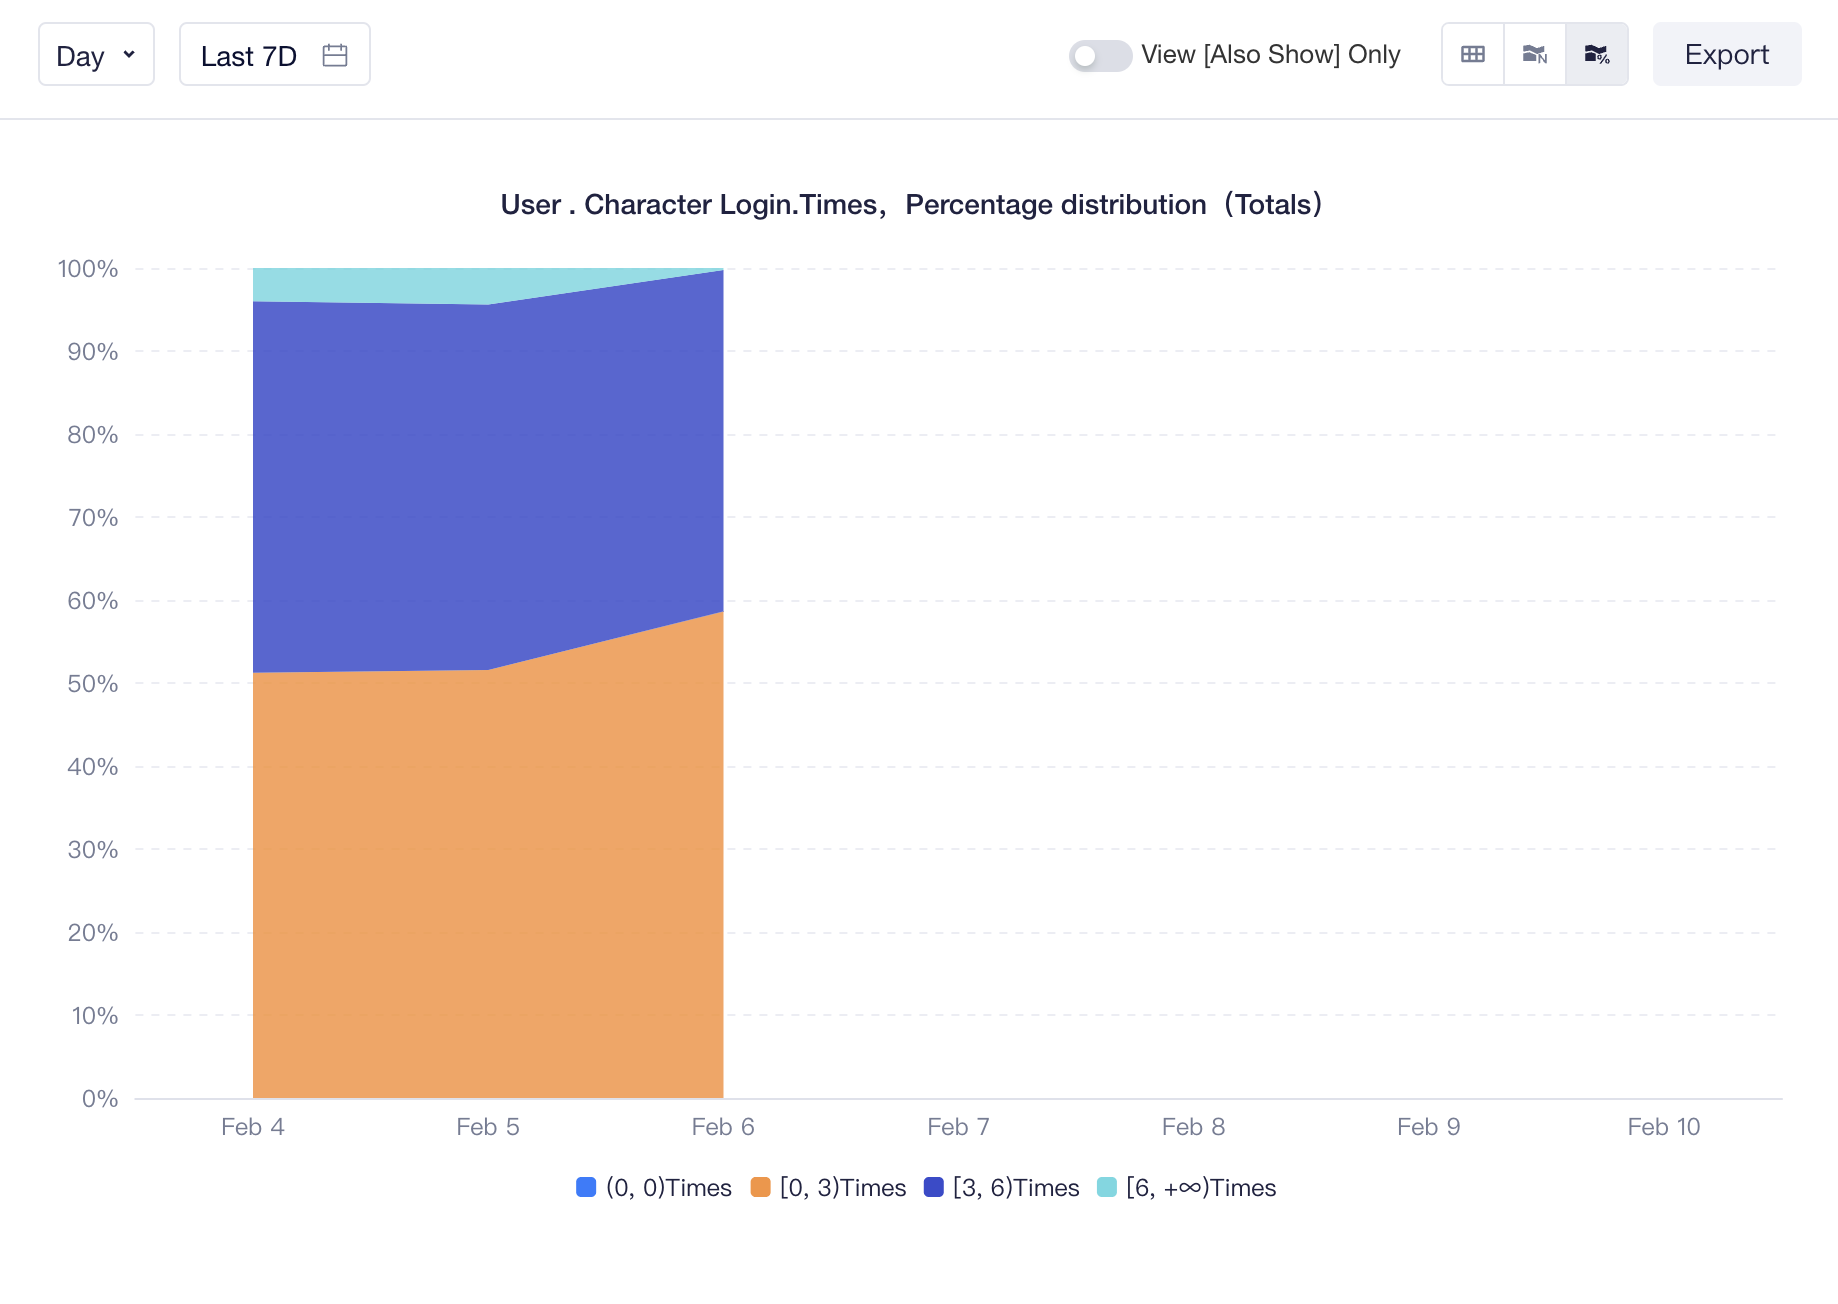
- Percentage Distribution
Percentage Distribution shows the trend of the percentage of users of each range by date.
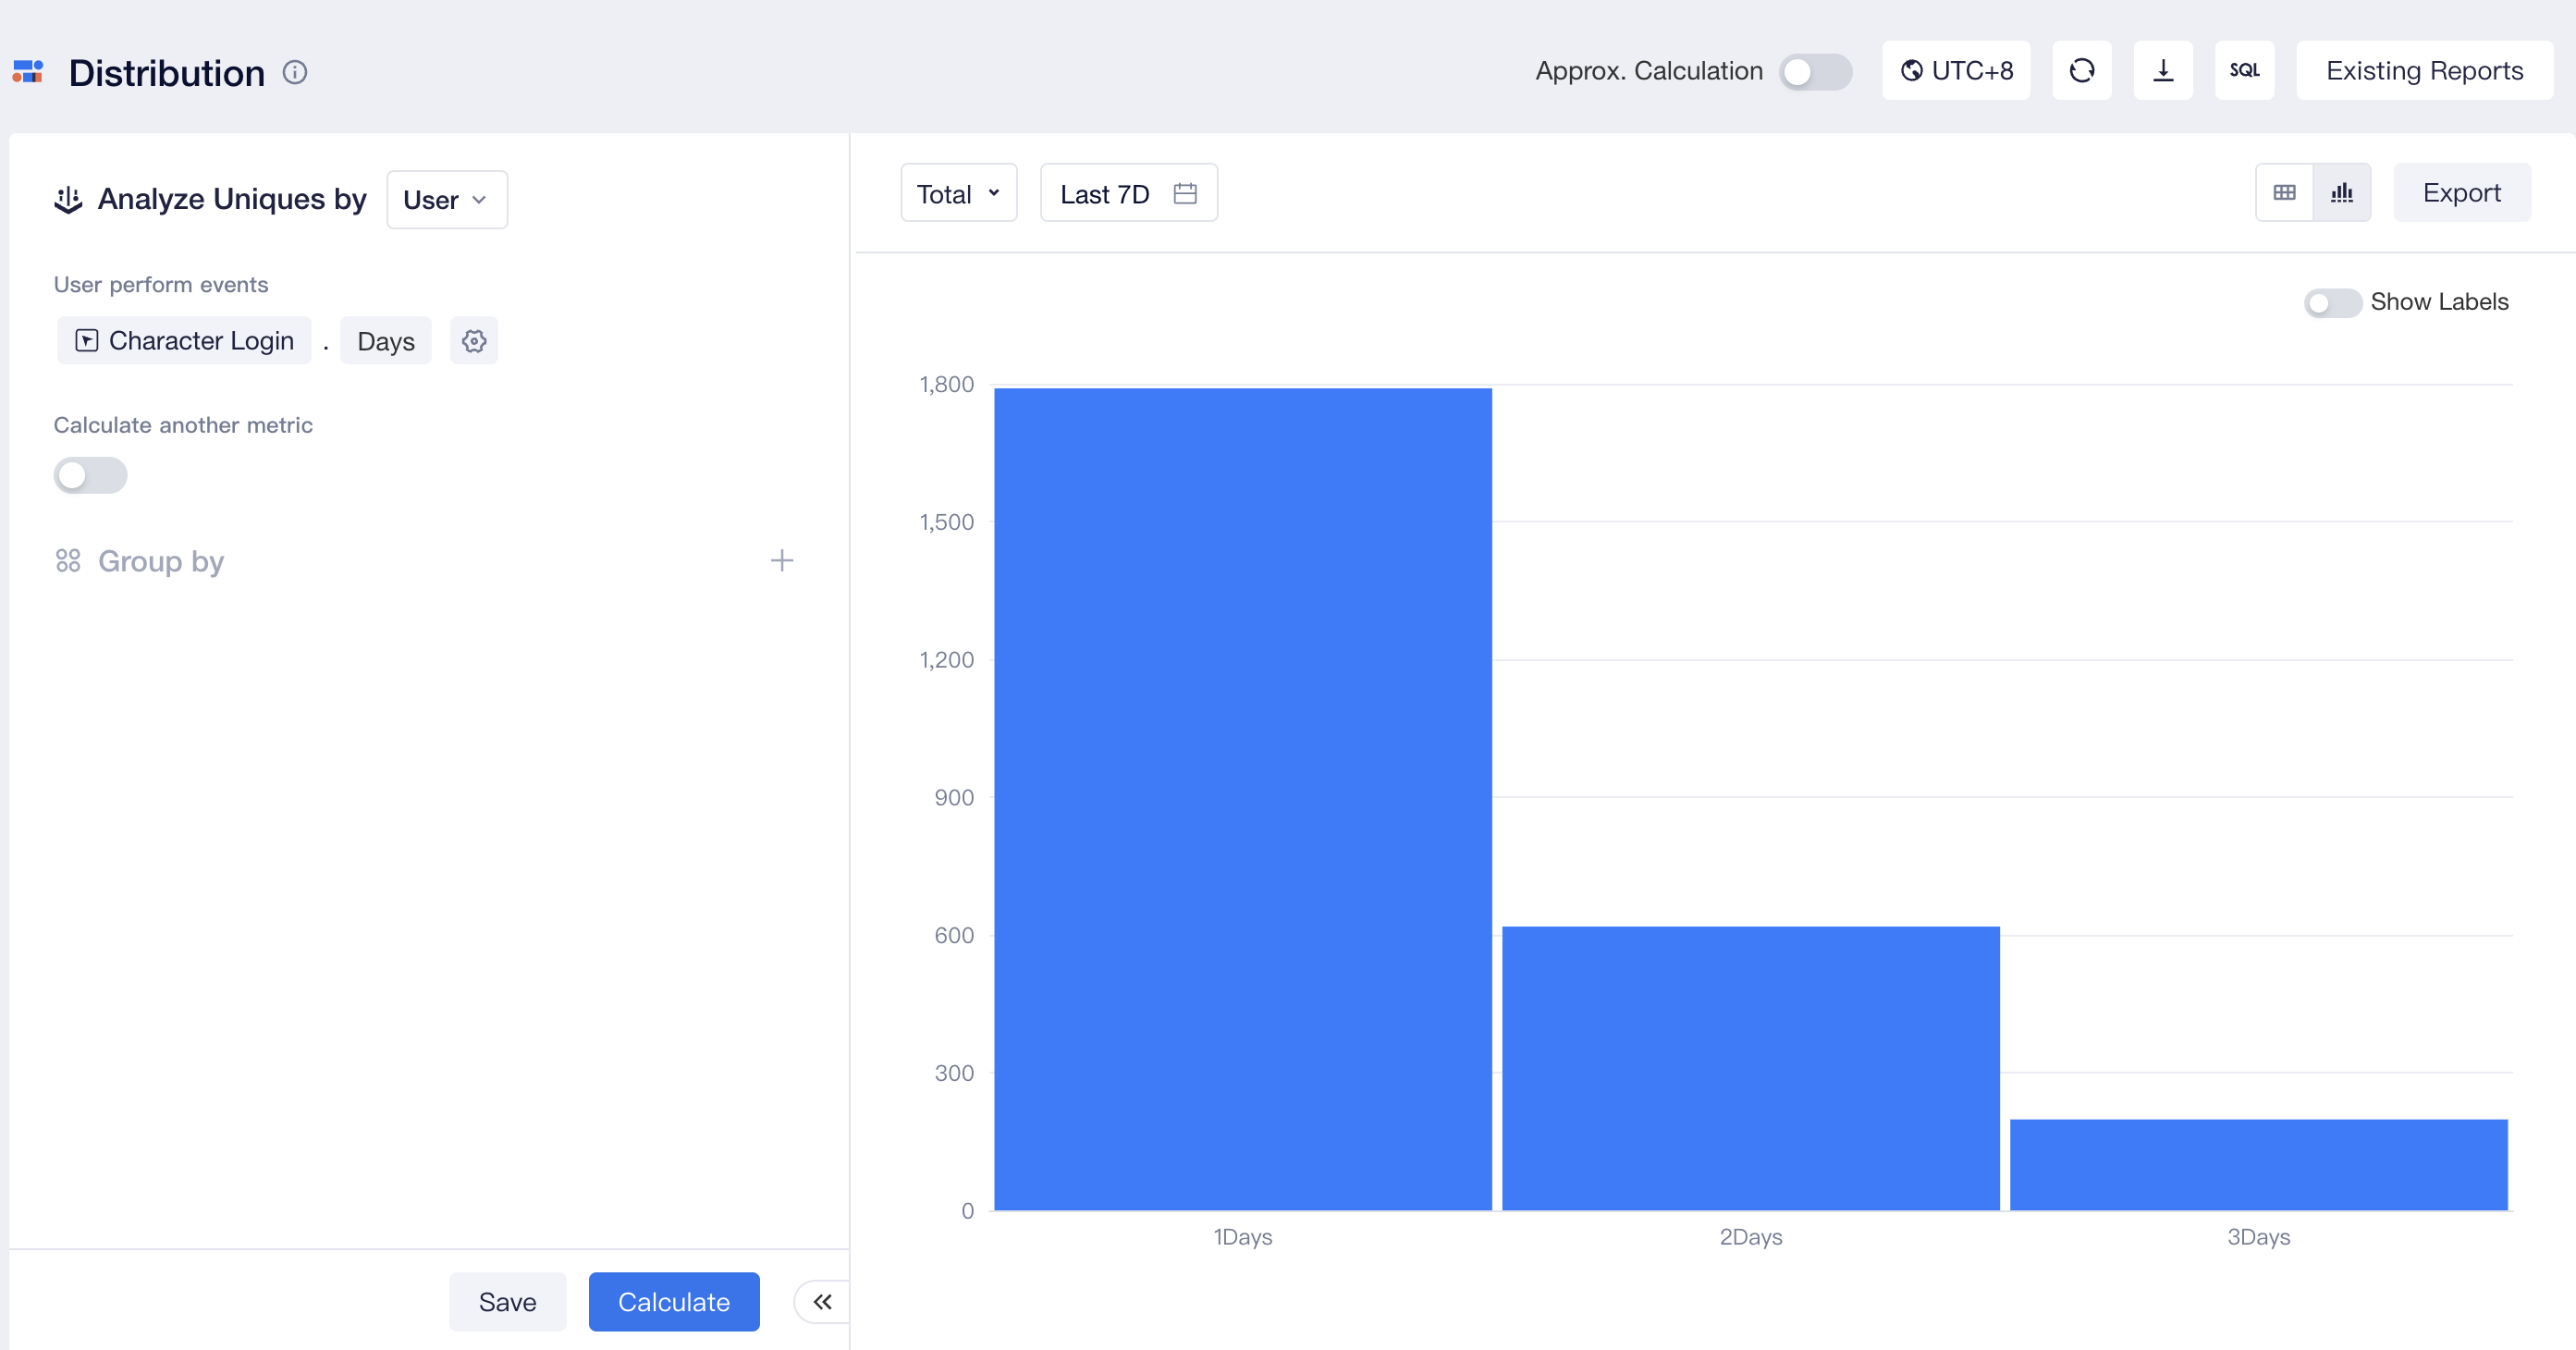
- Histogram
When you select "Total" as the granularity of time, you can directly view the number of entities within each range during the selected period of time in a histogram.

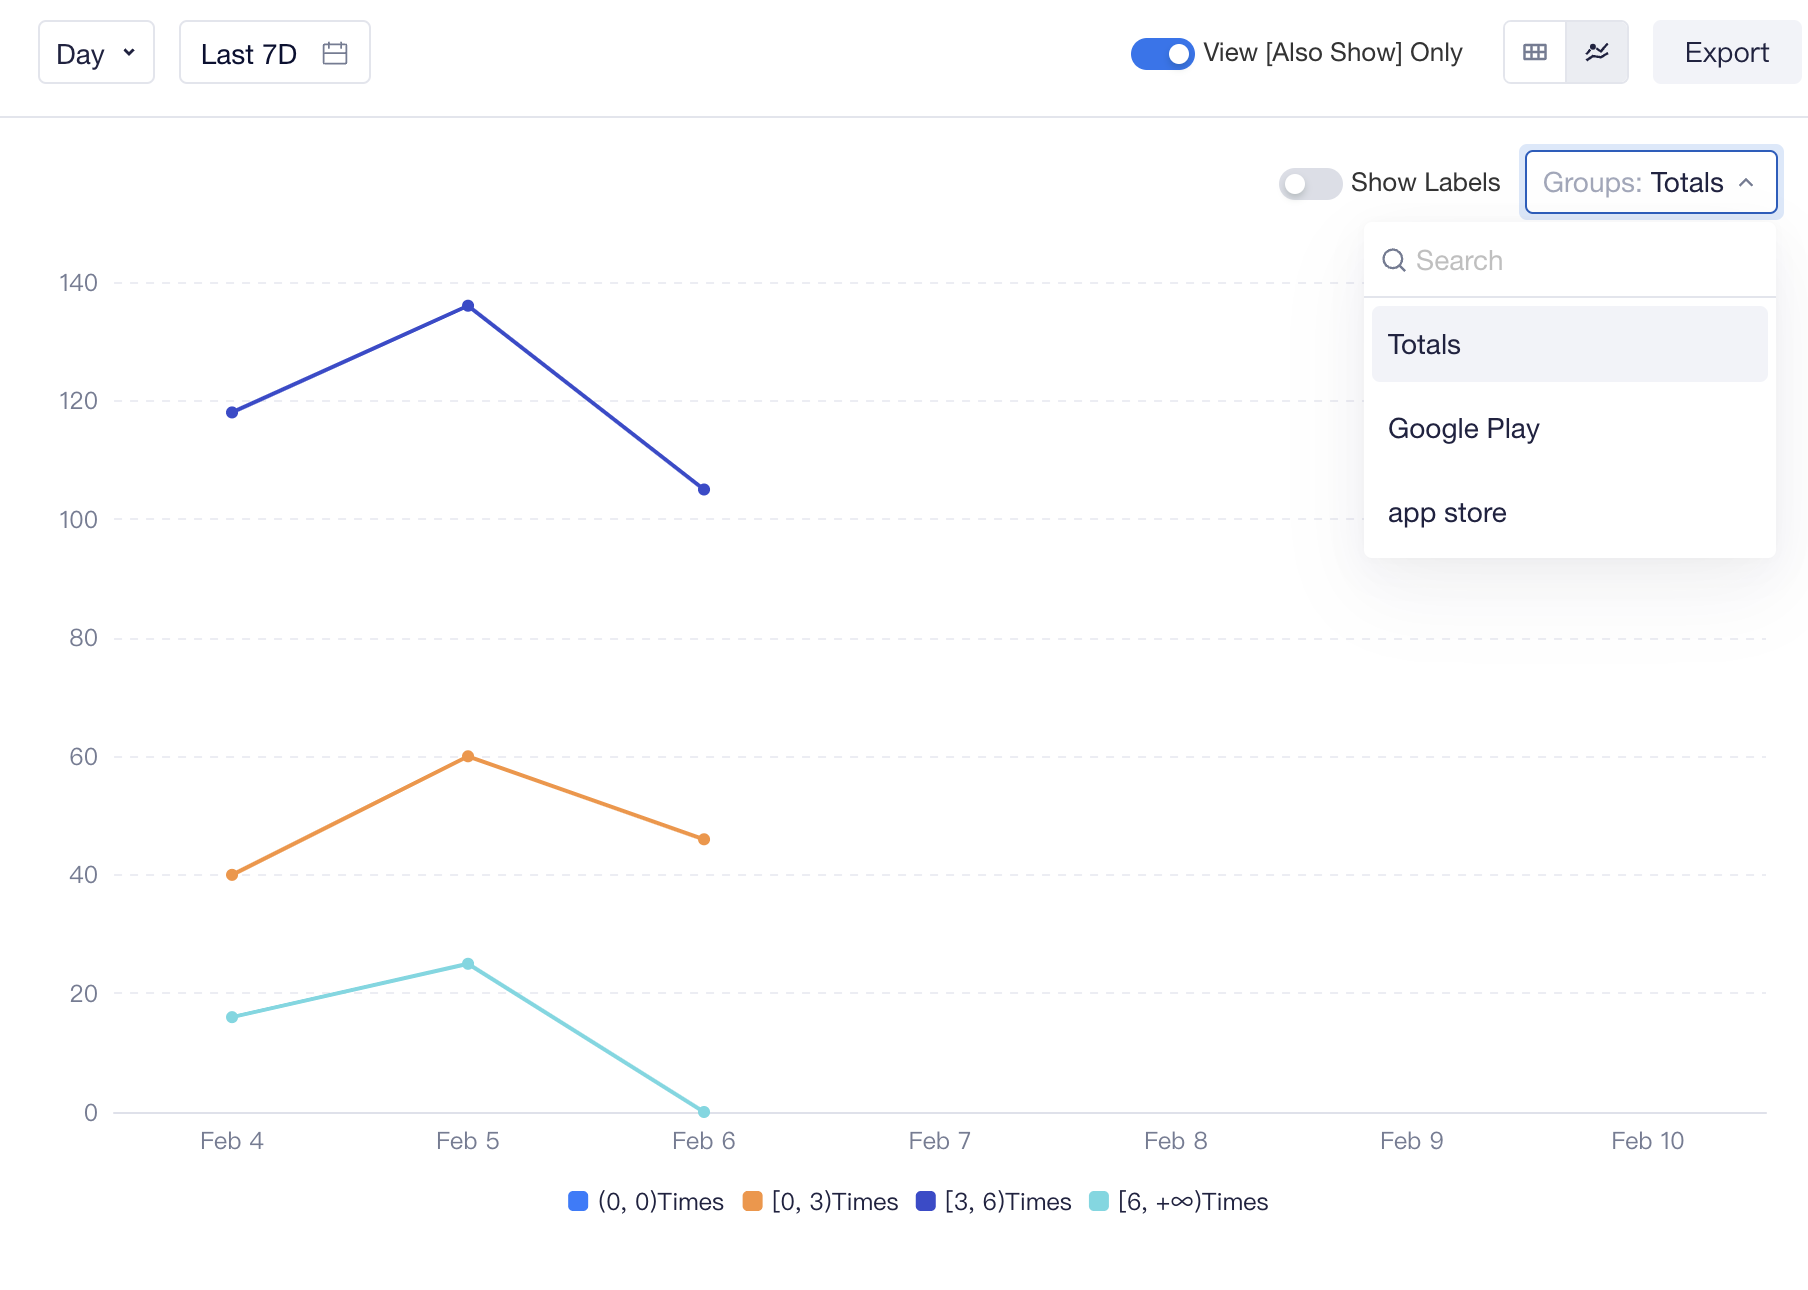
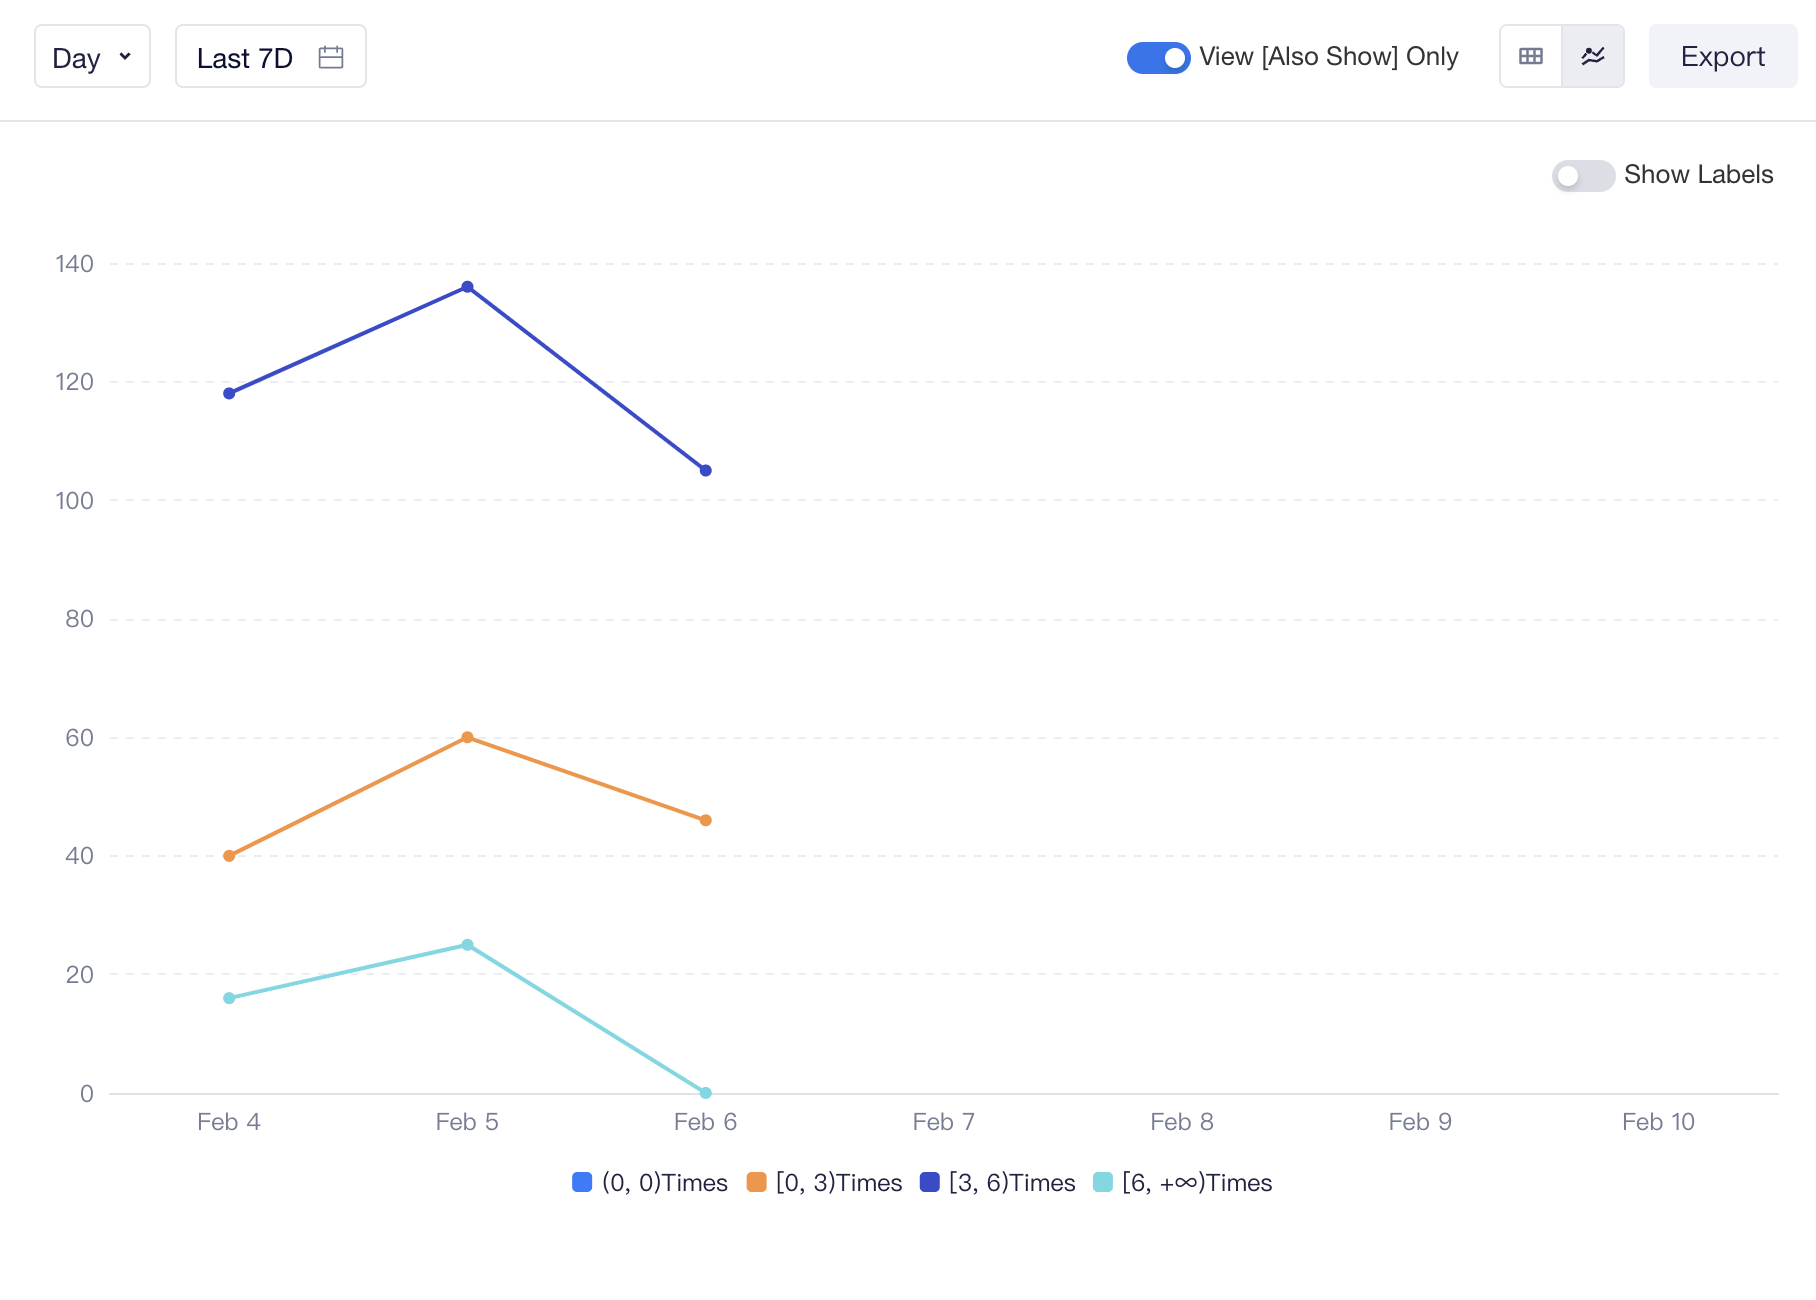
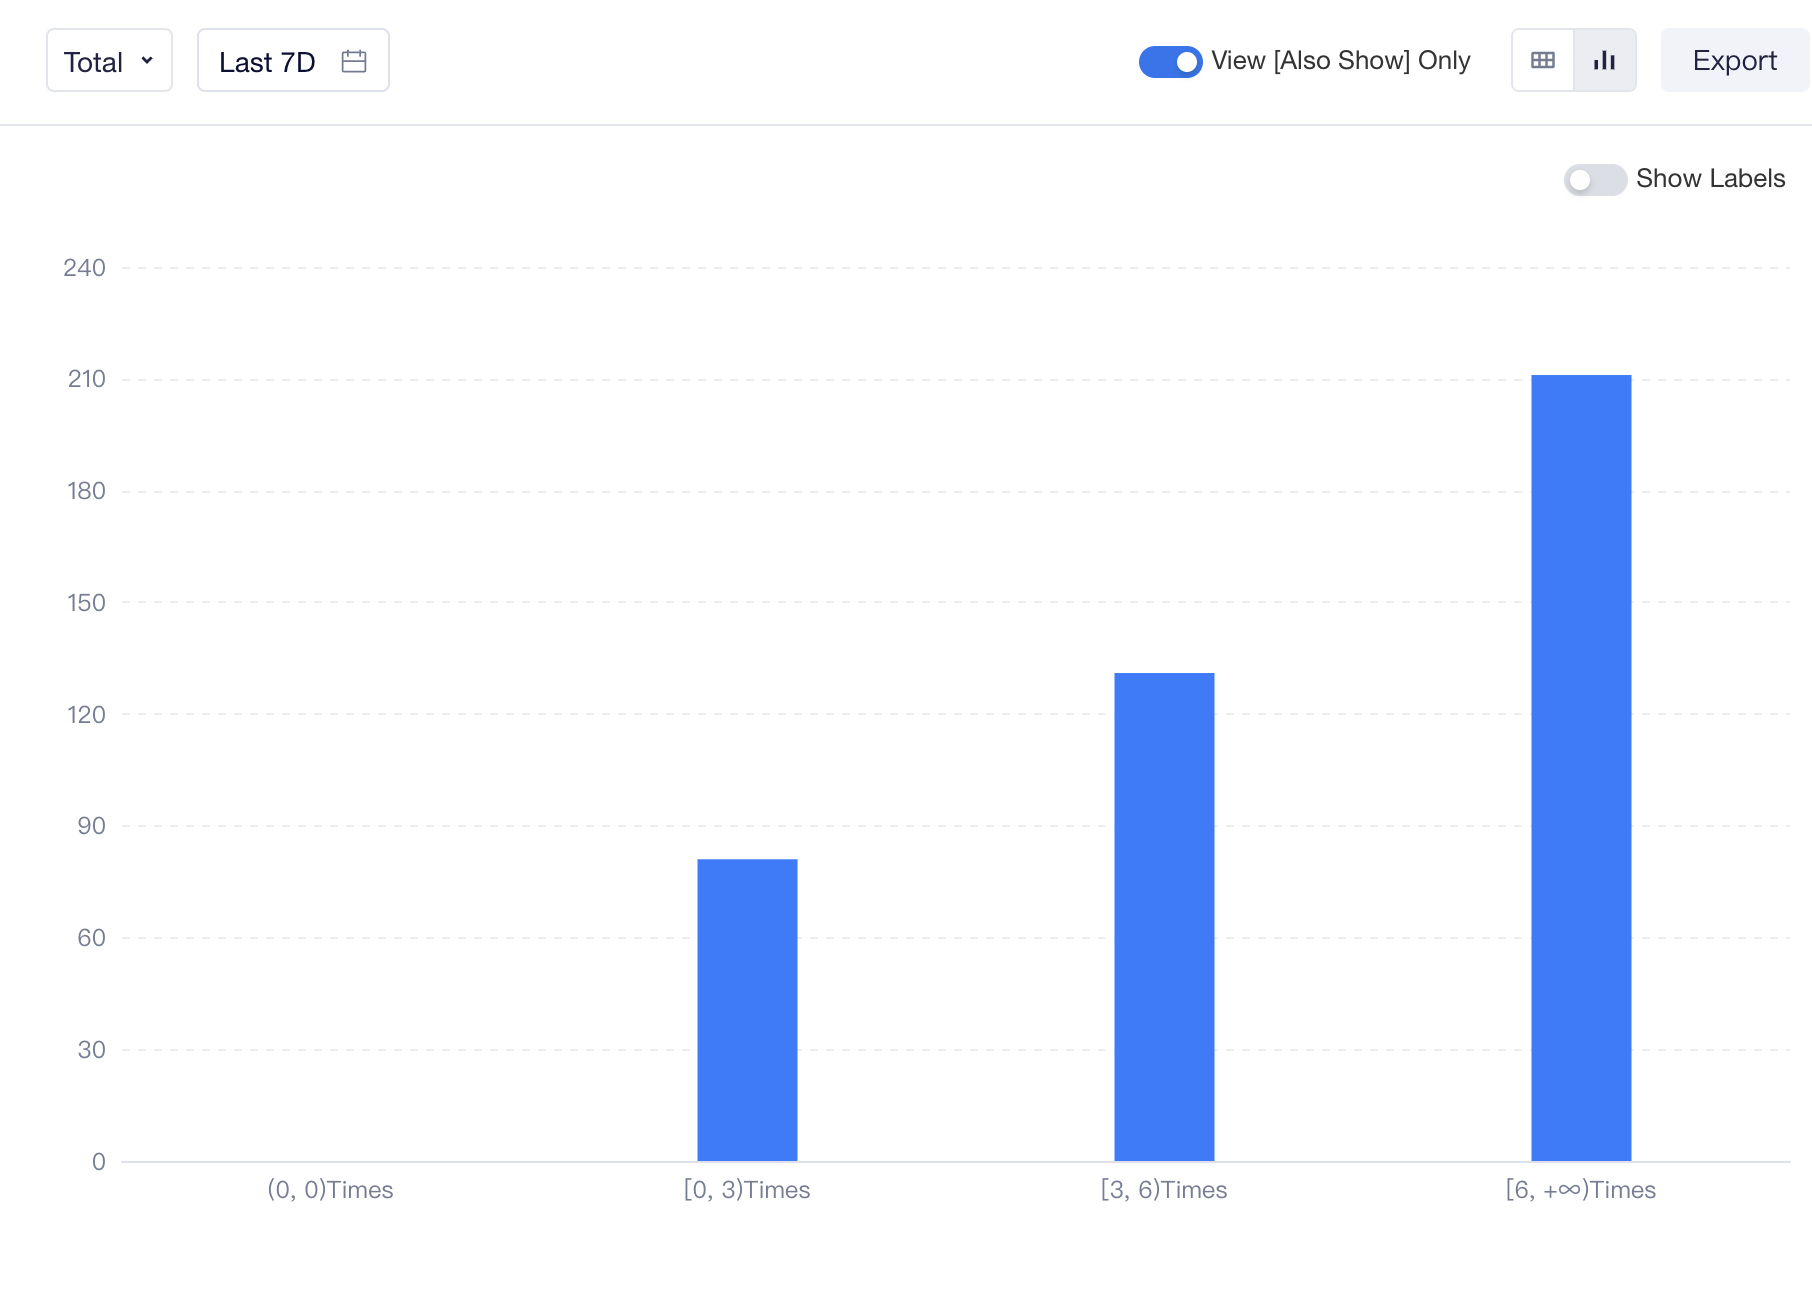
If you want to "View Also Show Metrics Only", you can select the following types of charts:
- Line graph
A line graph shows the trend of Also Show metrics of user entities across different ranges by date.
- Bar chart
When you select "total" as the granularity of time, you can view data of Also Show metrics of user entities in each range during the selected period of time in a bar chart.
When Group by is used, apart from tables, other types of charts can only display data performance of one group. If you have added group-by items, you can click "Groups" to switch between different groups. By default, total data are displayed (without group-by items).