# Best Practices
In practice, you can combine different models to carry out analysis from different perspectives.
# Second-day churn
Second-day churn is an analytical metric drawing attention in almost all projects. Only by identifying the real causes of user churns can targeted adjustments be made and the second-day churn rate be reduced.
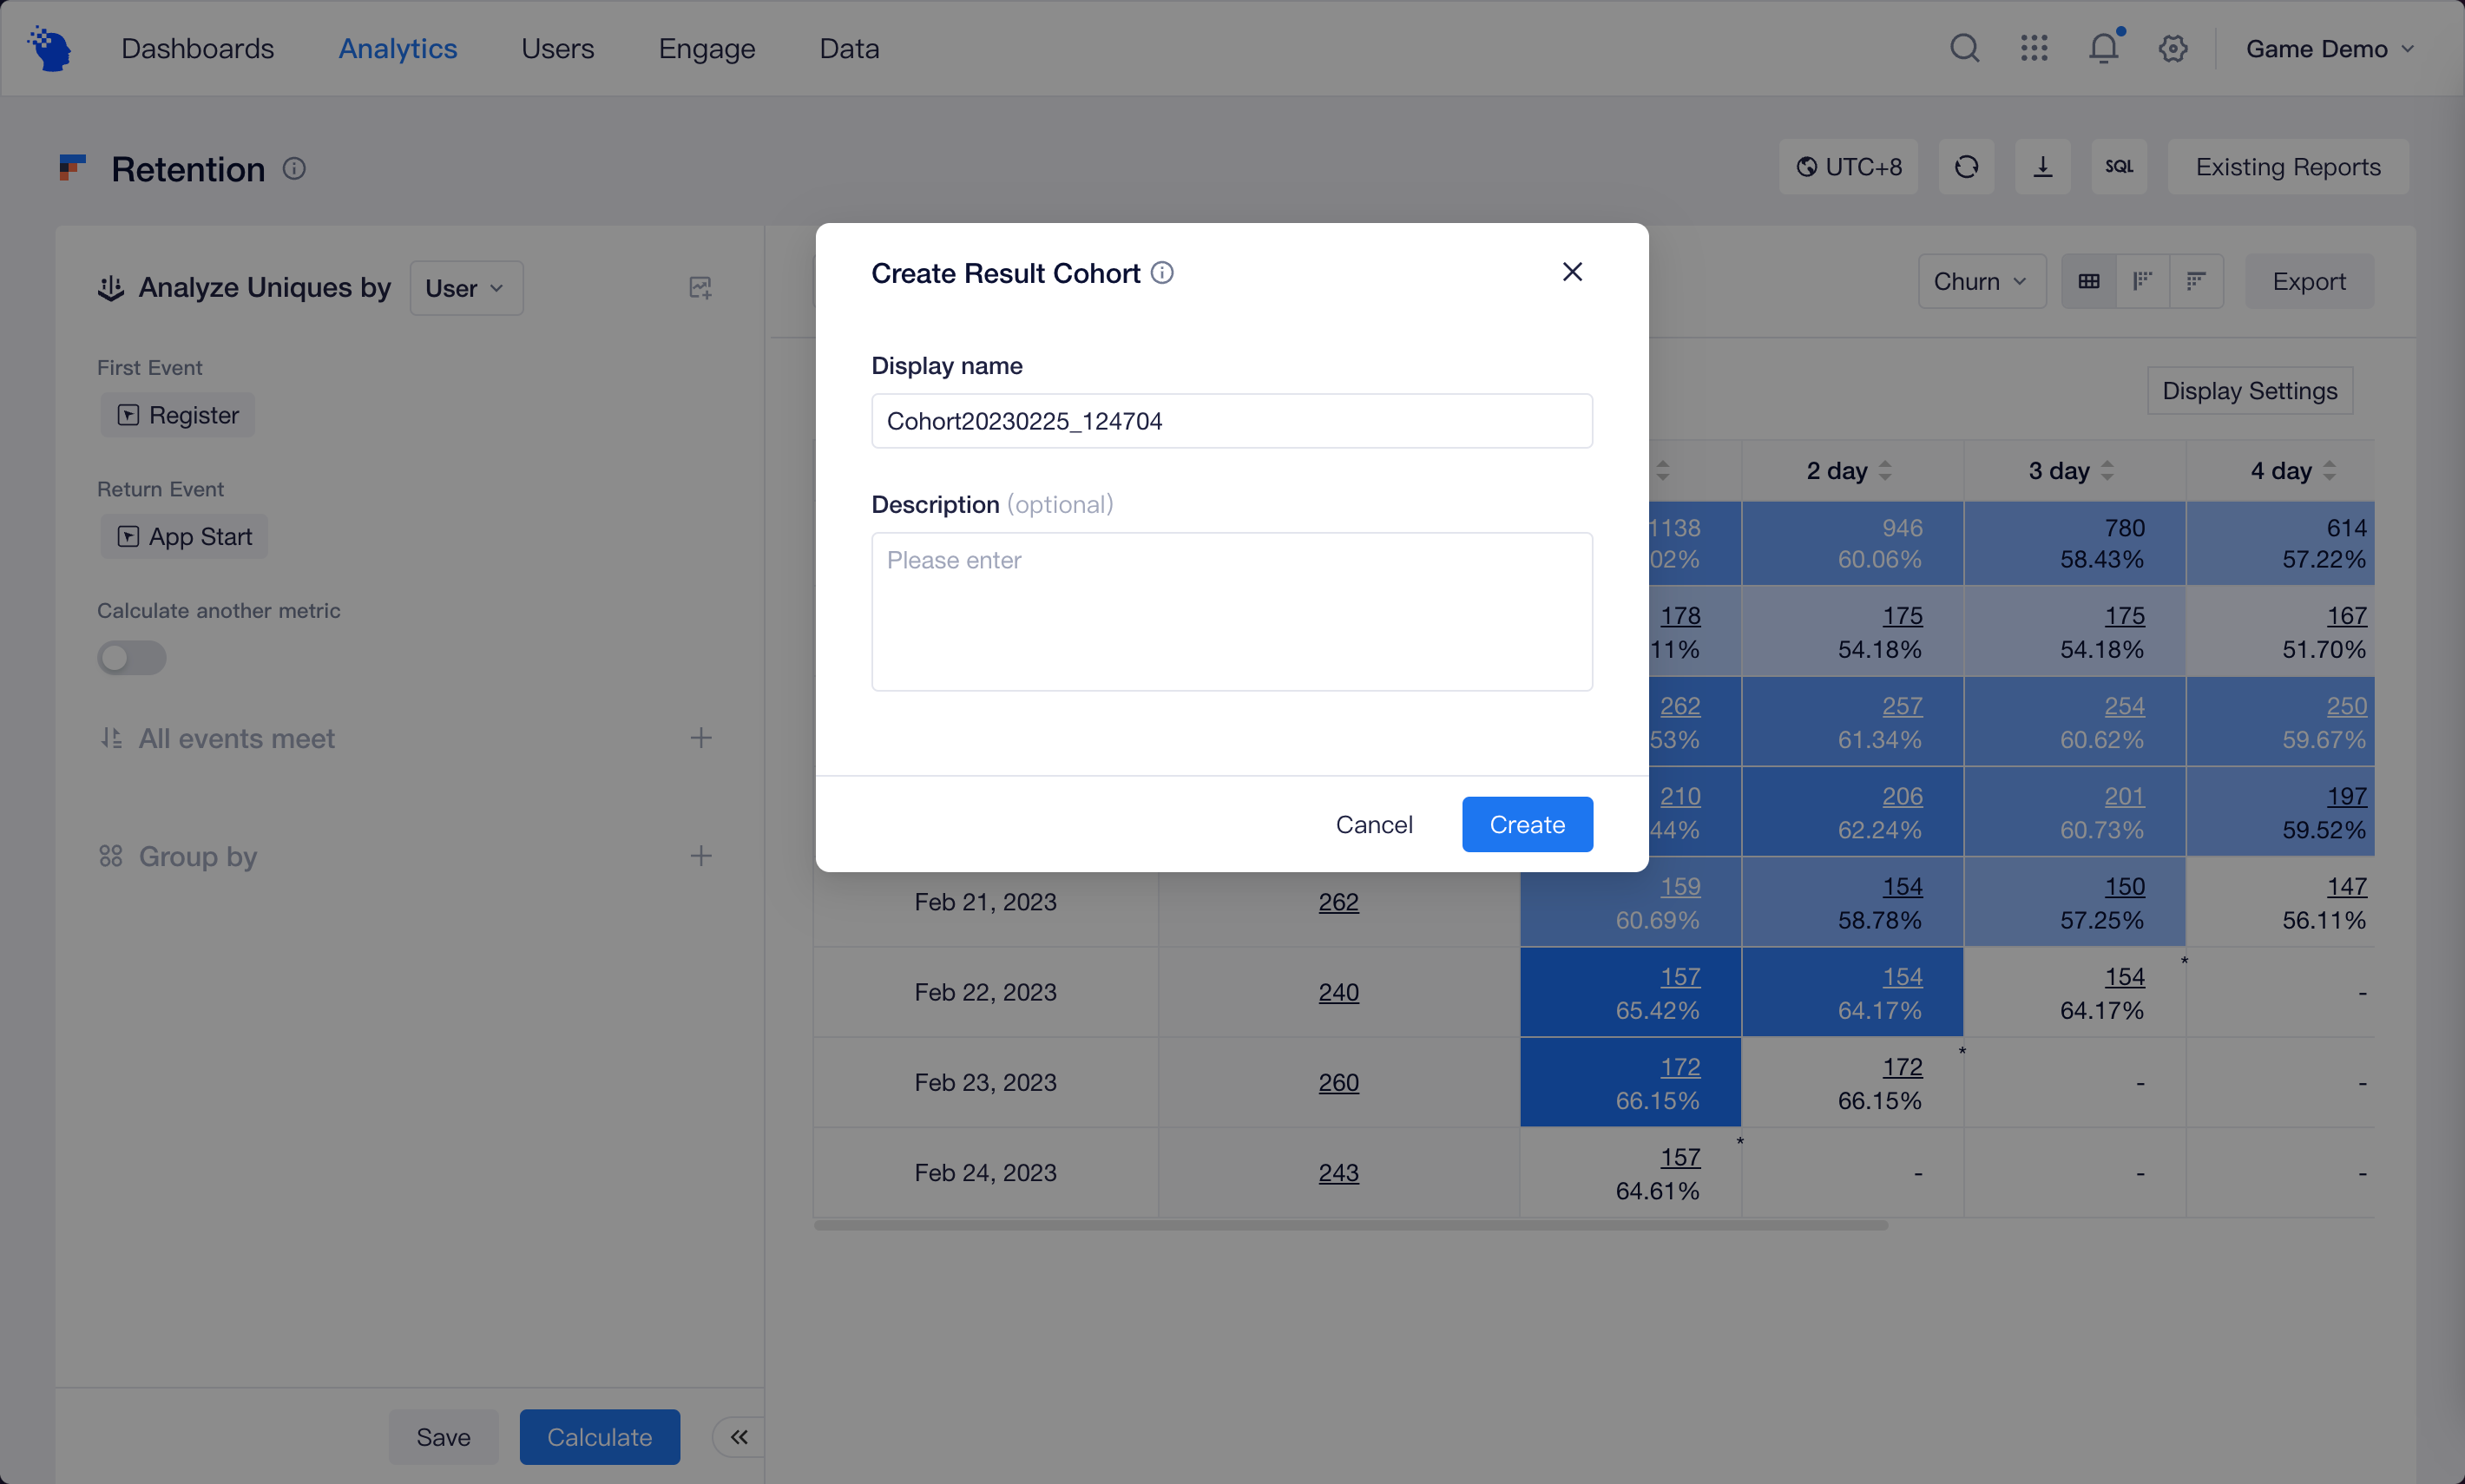
First, you should use registration as the trigger action and login as the return action in the Retention to observe second-day retention performance. After locating the date when data starts to drop, you can save users who registered accounts during the day and those who registered but not logged in on the second day respectively as the result cohorts.
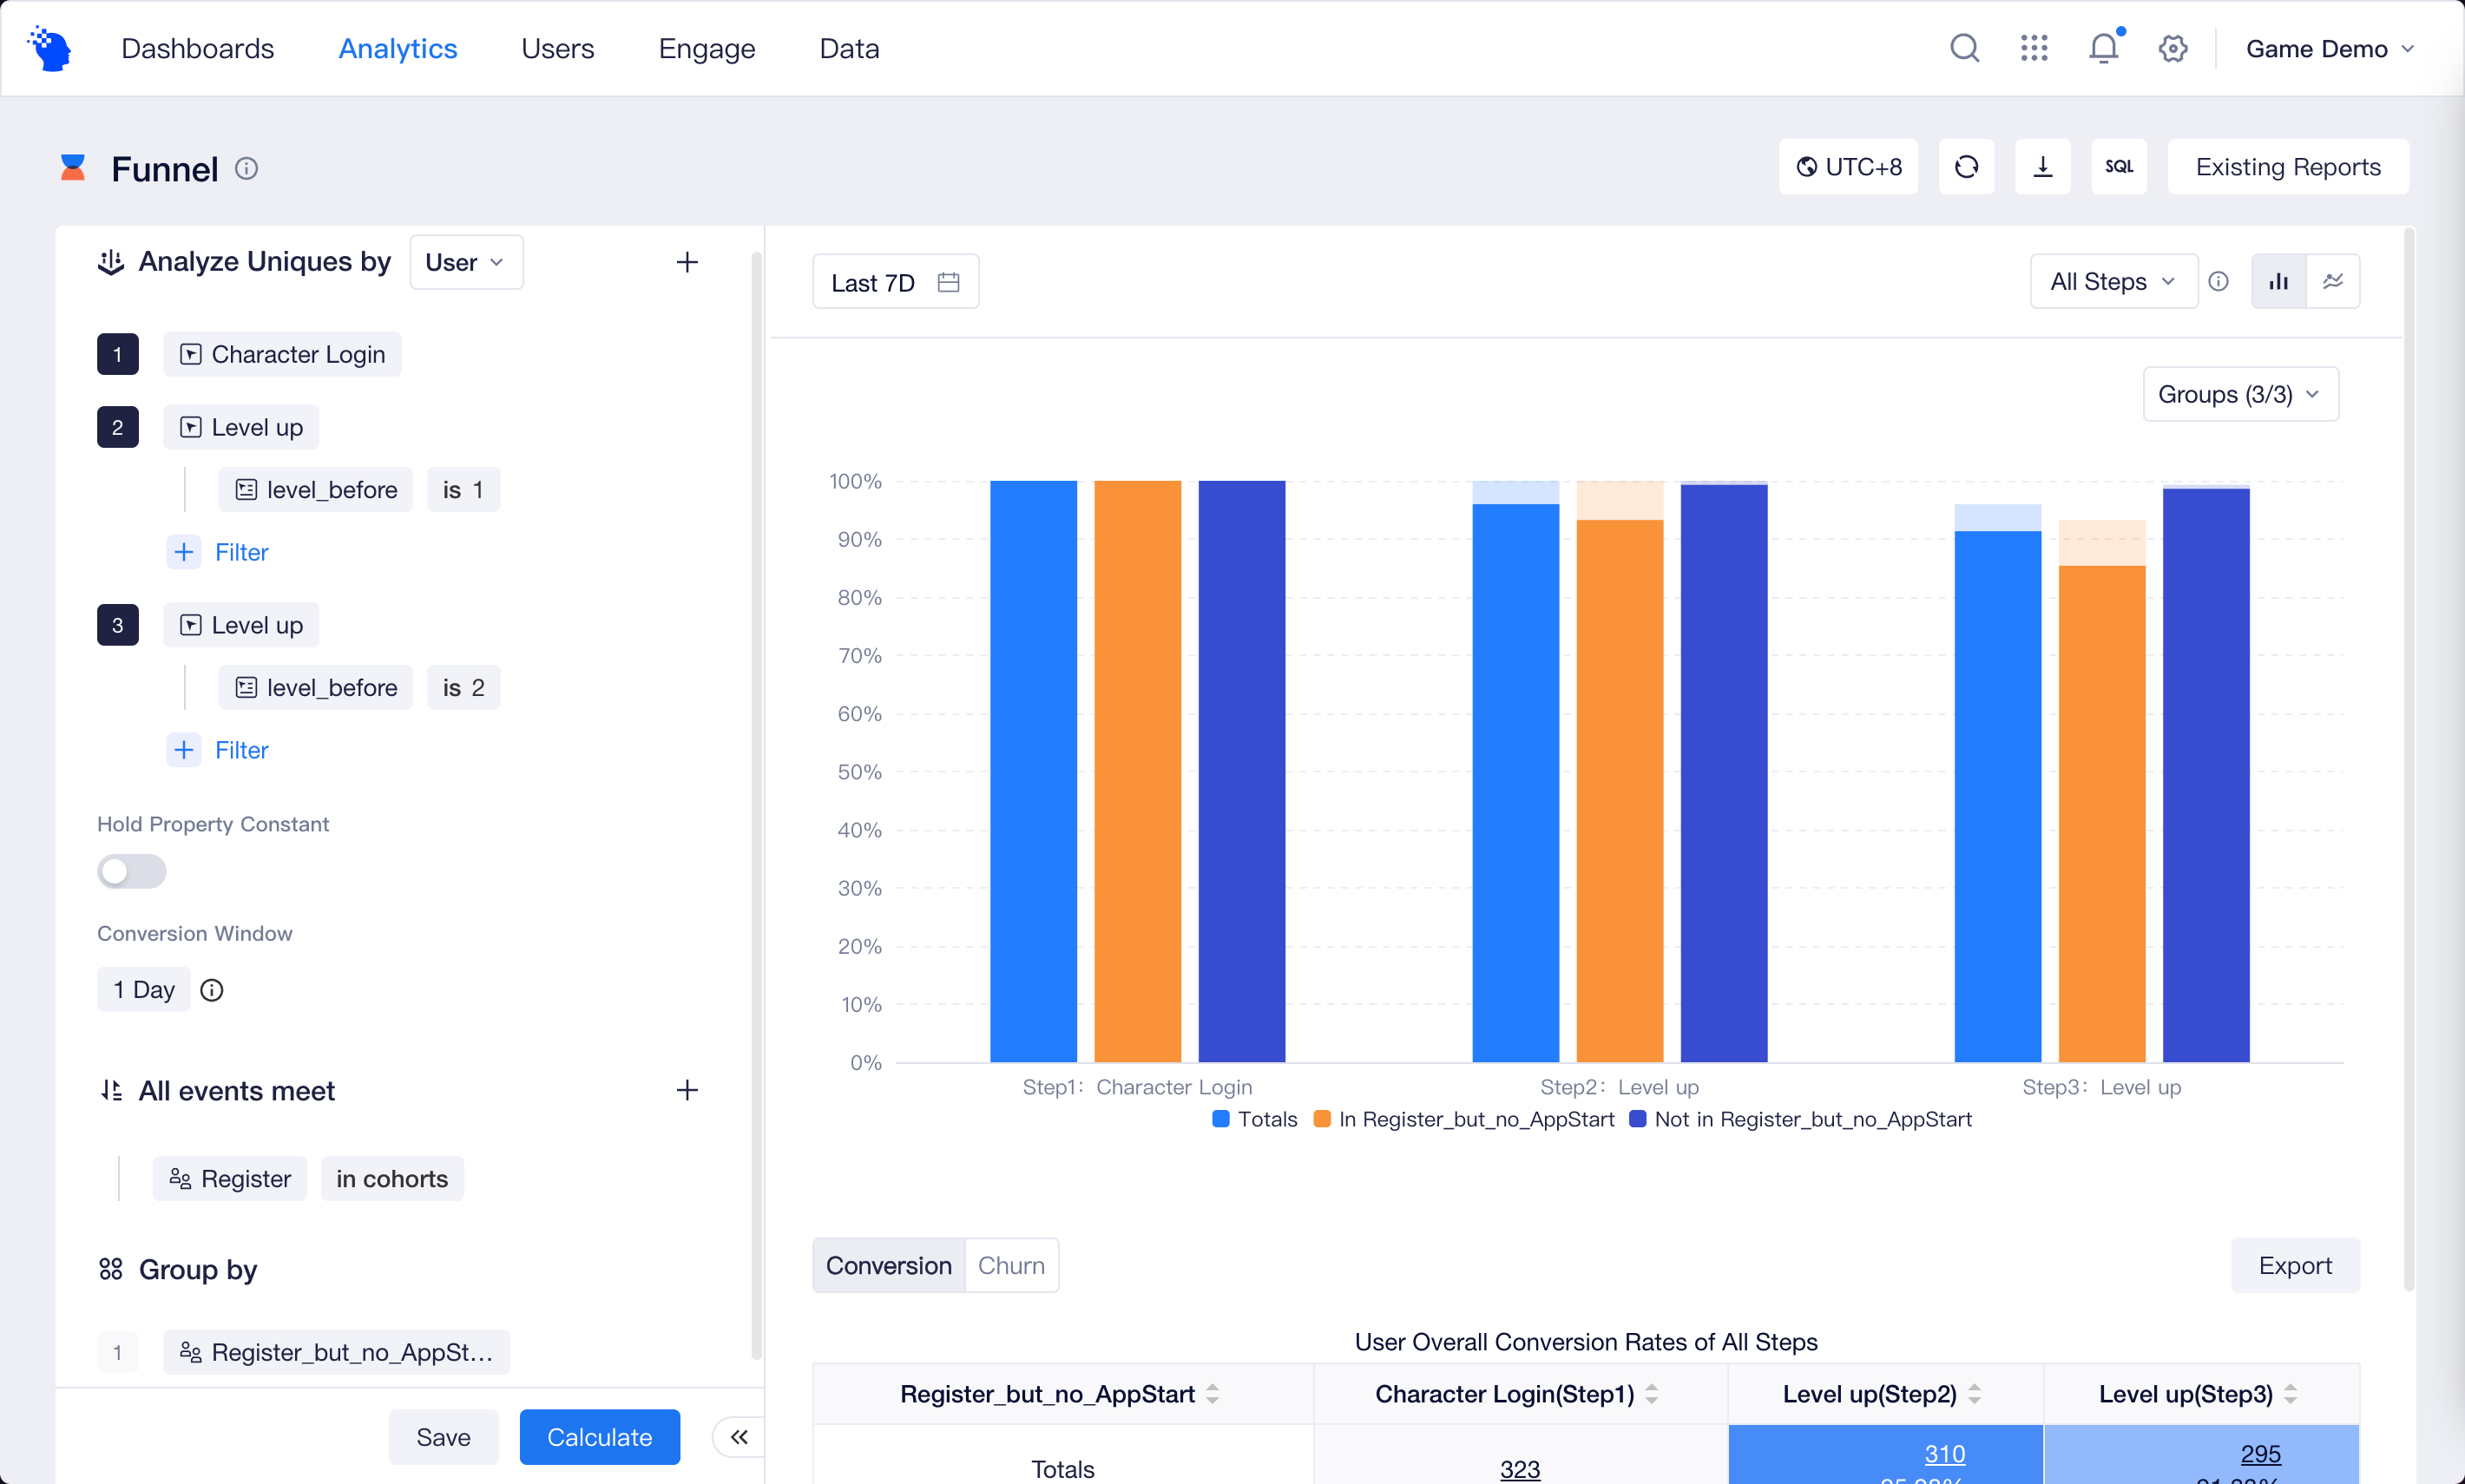
Next, using Funnel, you can view the daily pass retention of users on the day of registration and compare data performances of churned and retained users by grouping data by whether it falls in churned users.
In the meantime, you can also view Flows of churned users since registration, find their last core gameplay modes and analyze whether the gameplay modes cause users to have a sense of frustration and lose activity, such as failures in arena combat or disappointment in card drawing results.

# Payment behavior analysis
Payment behavior is the focus of data analysis, which can be analyzed from multiple perspectives.
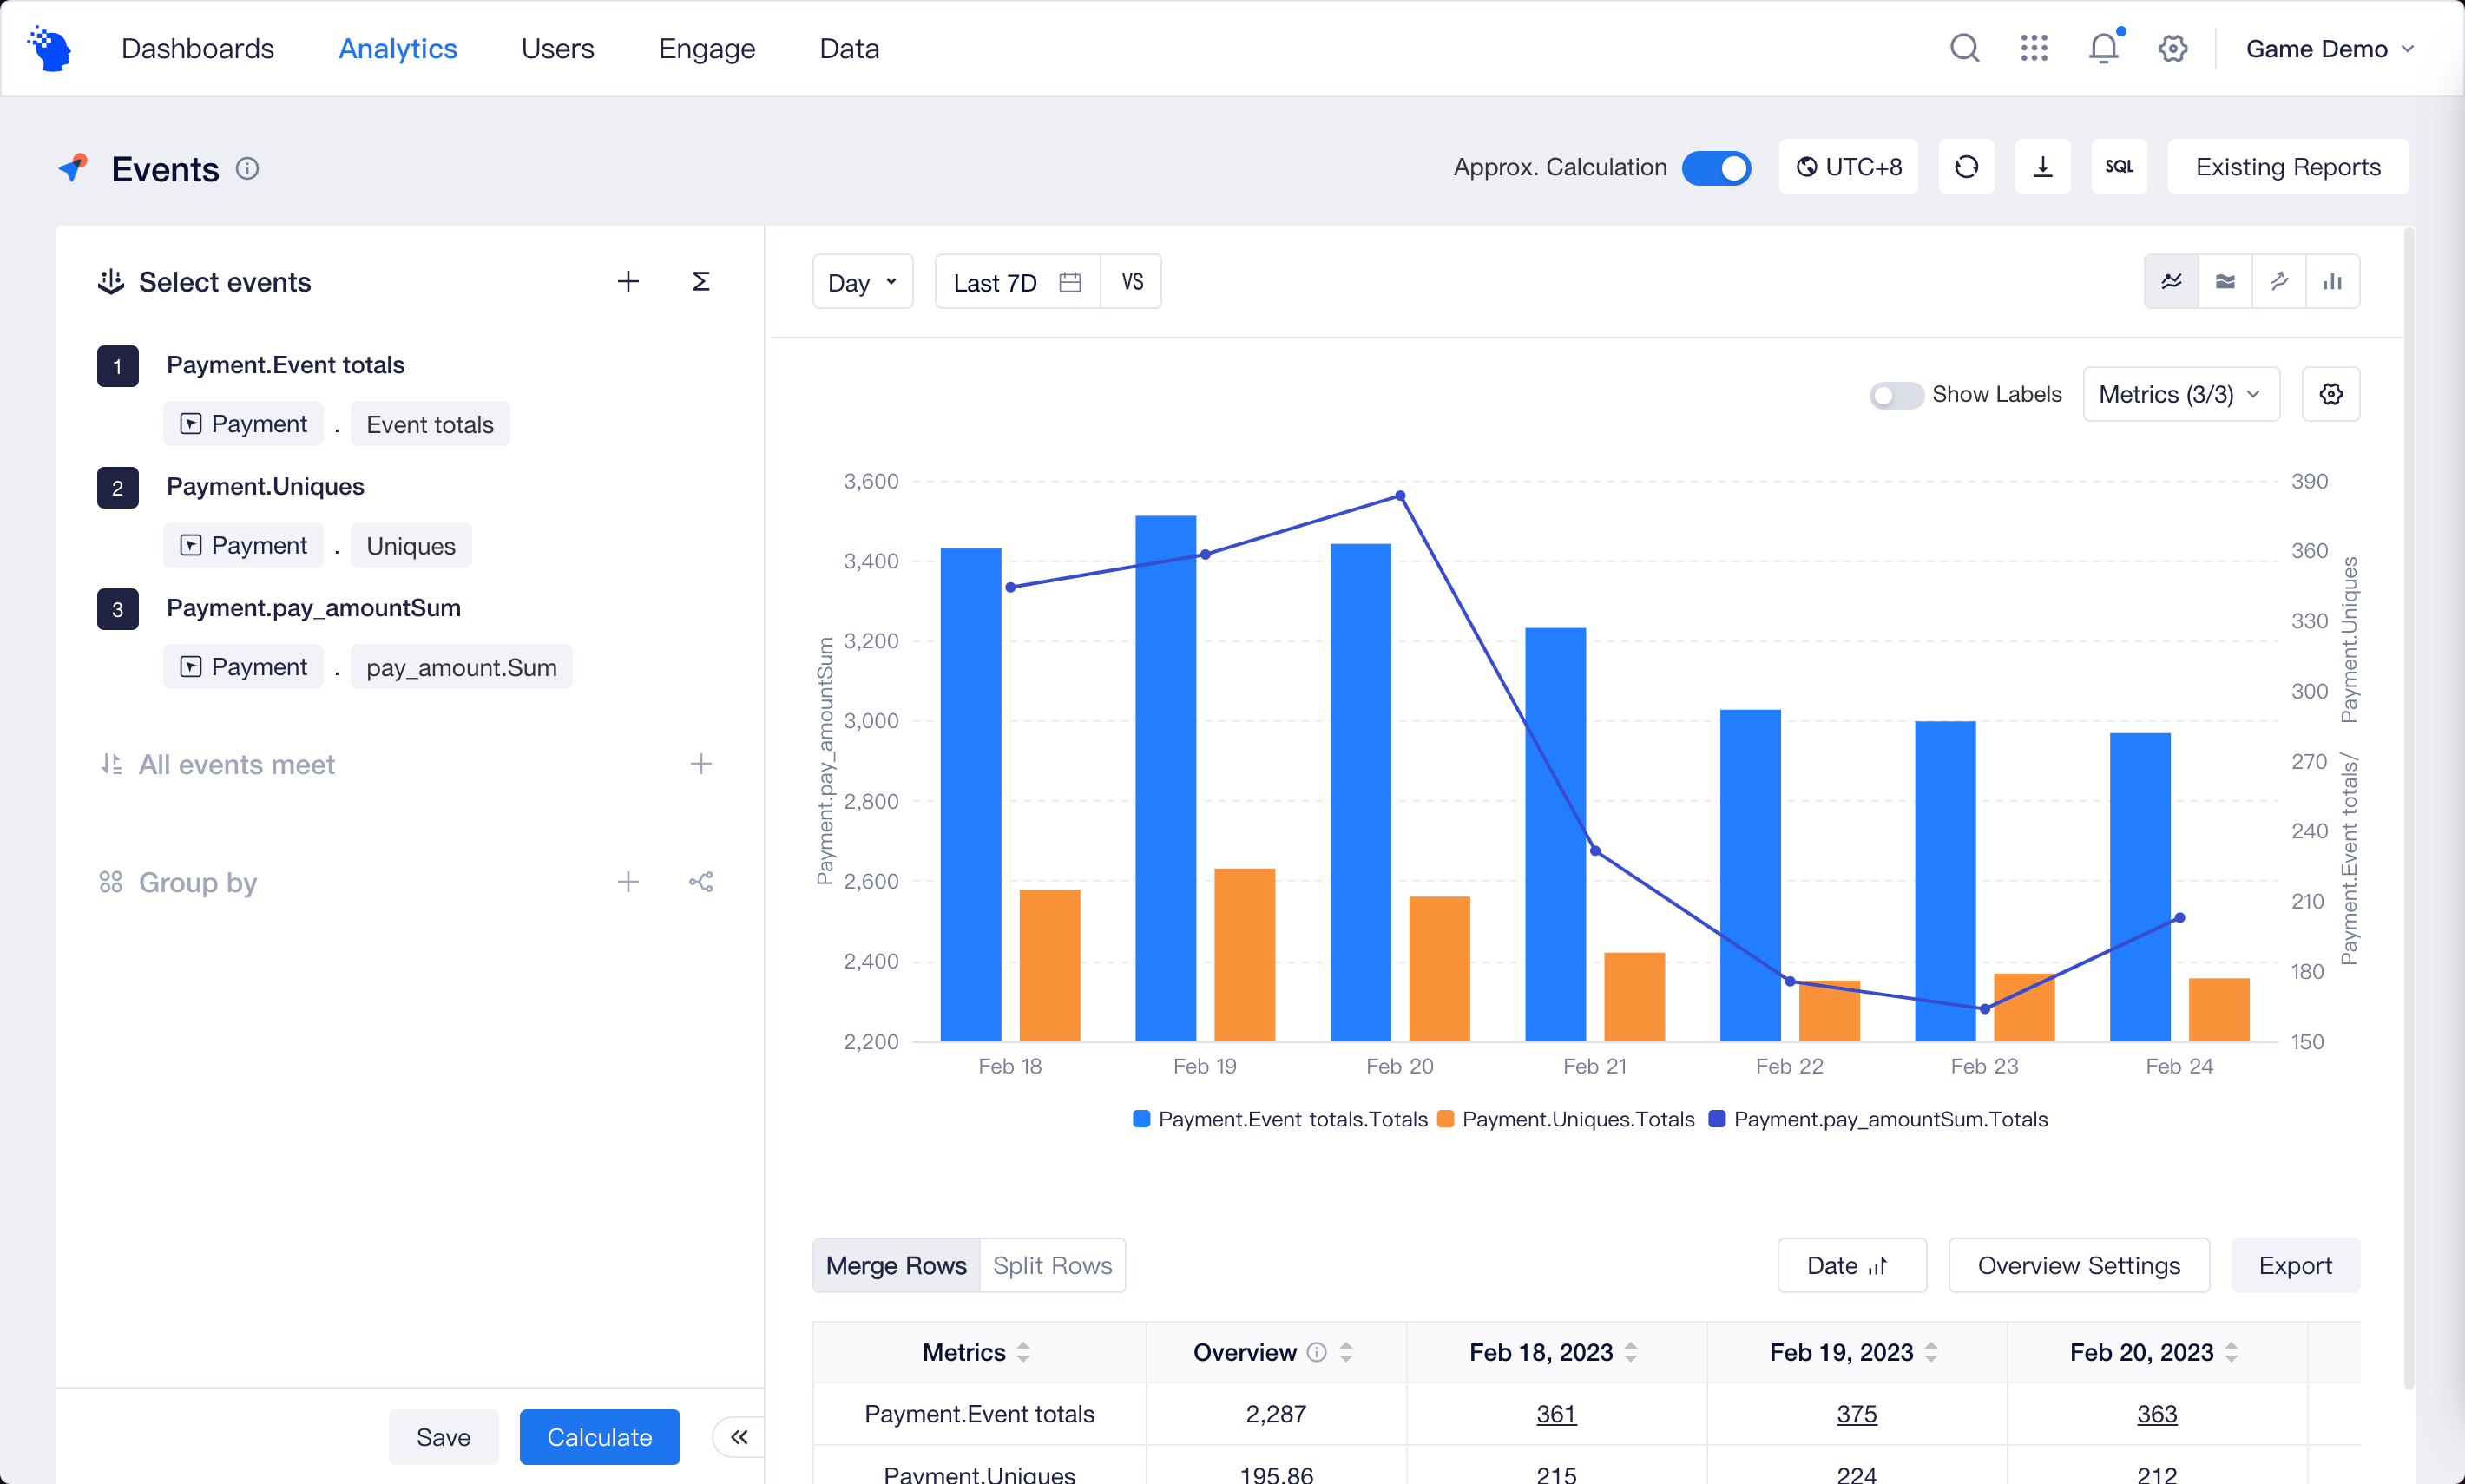
The most fundamental is Events. Using total times, population and total amount of payment behaviors as analysis metrics, you can view changes in these data over a period of time.
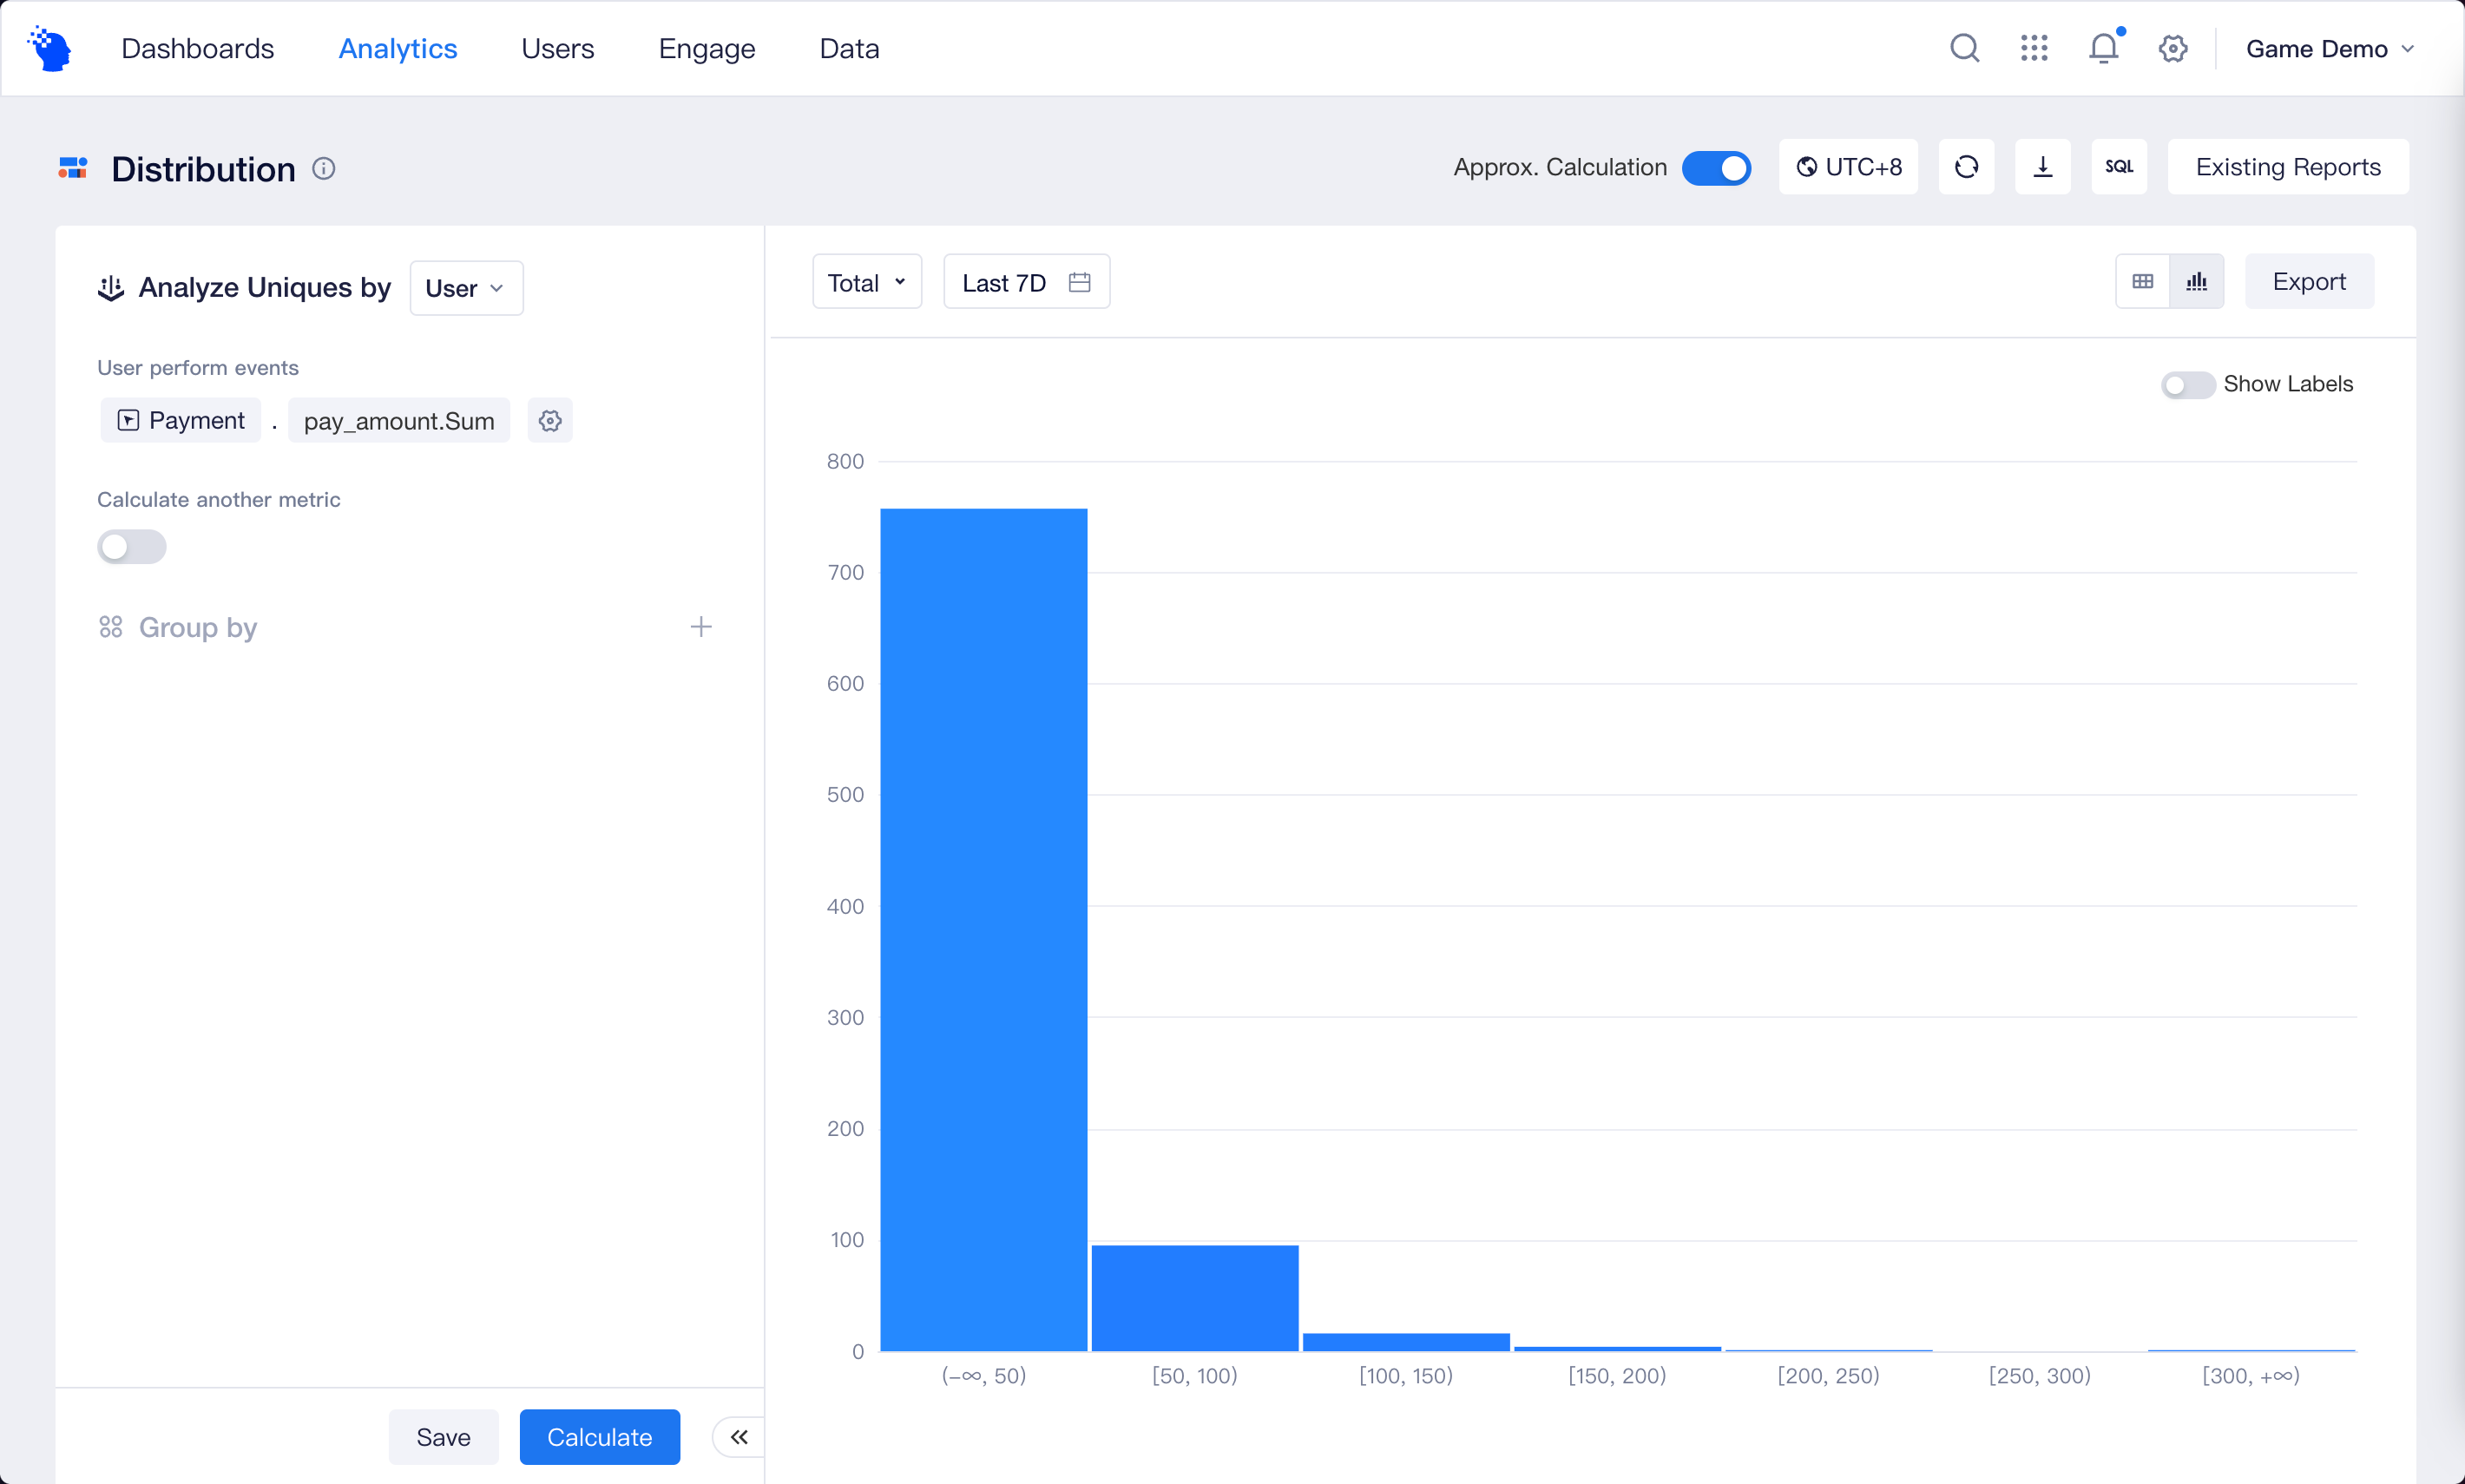
Next, you can divide the selected time range of Distribution based on the total amount of user payments within the period, to view the population and percentage of each interval.
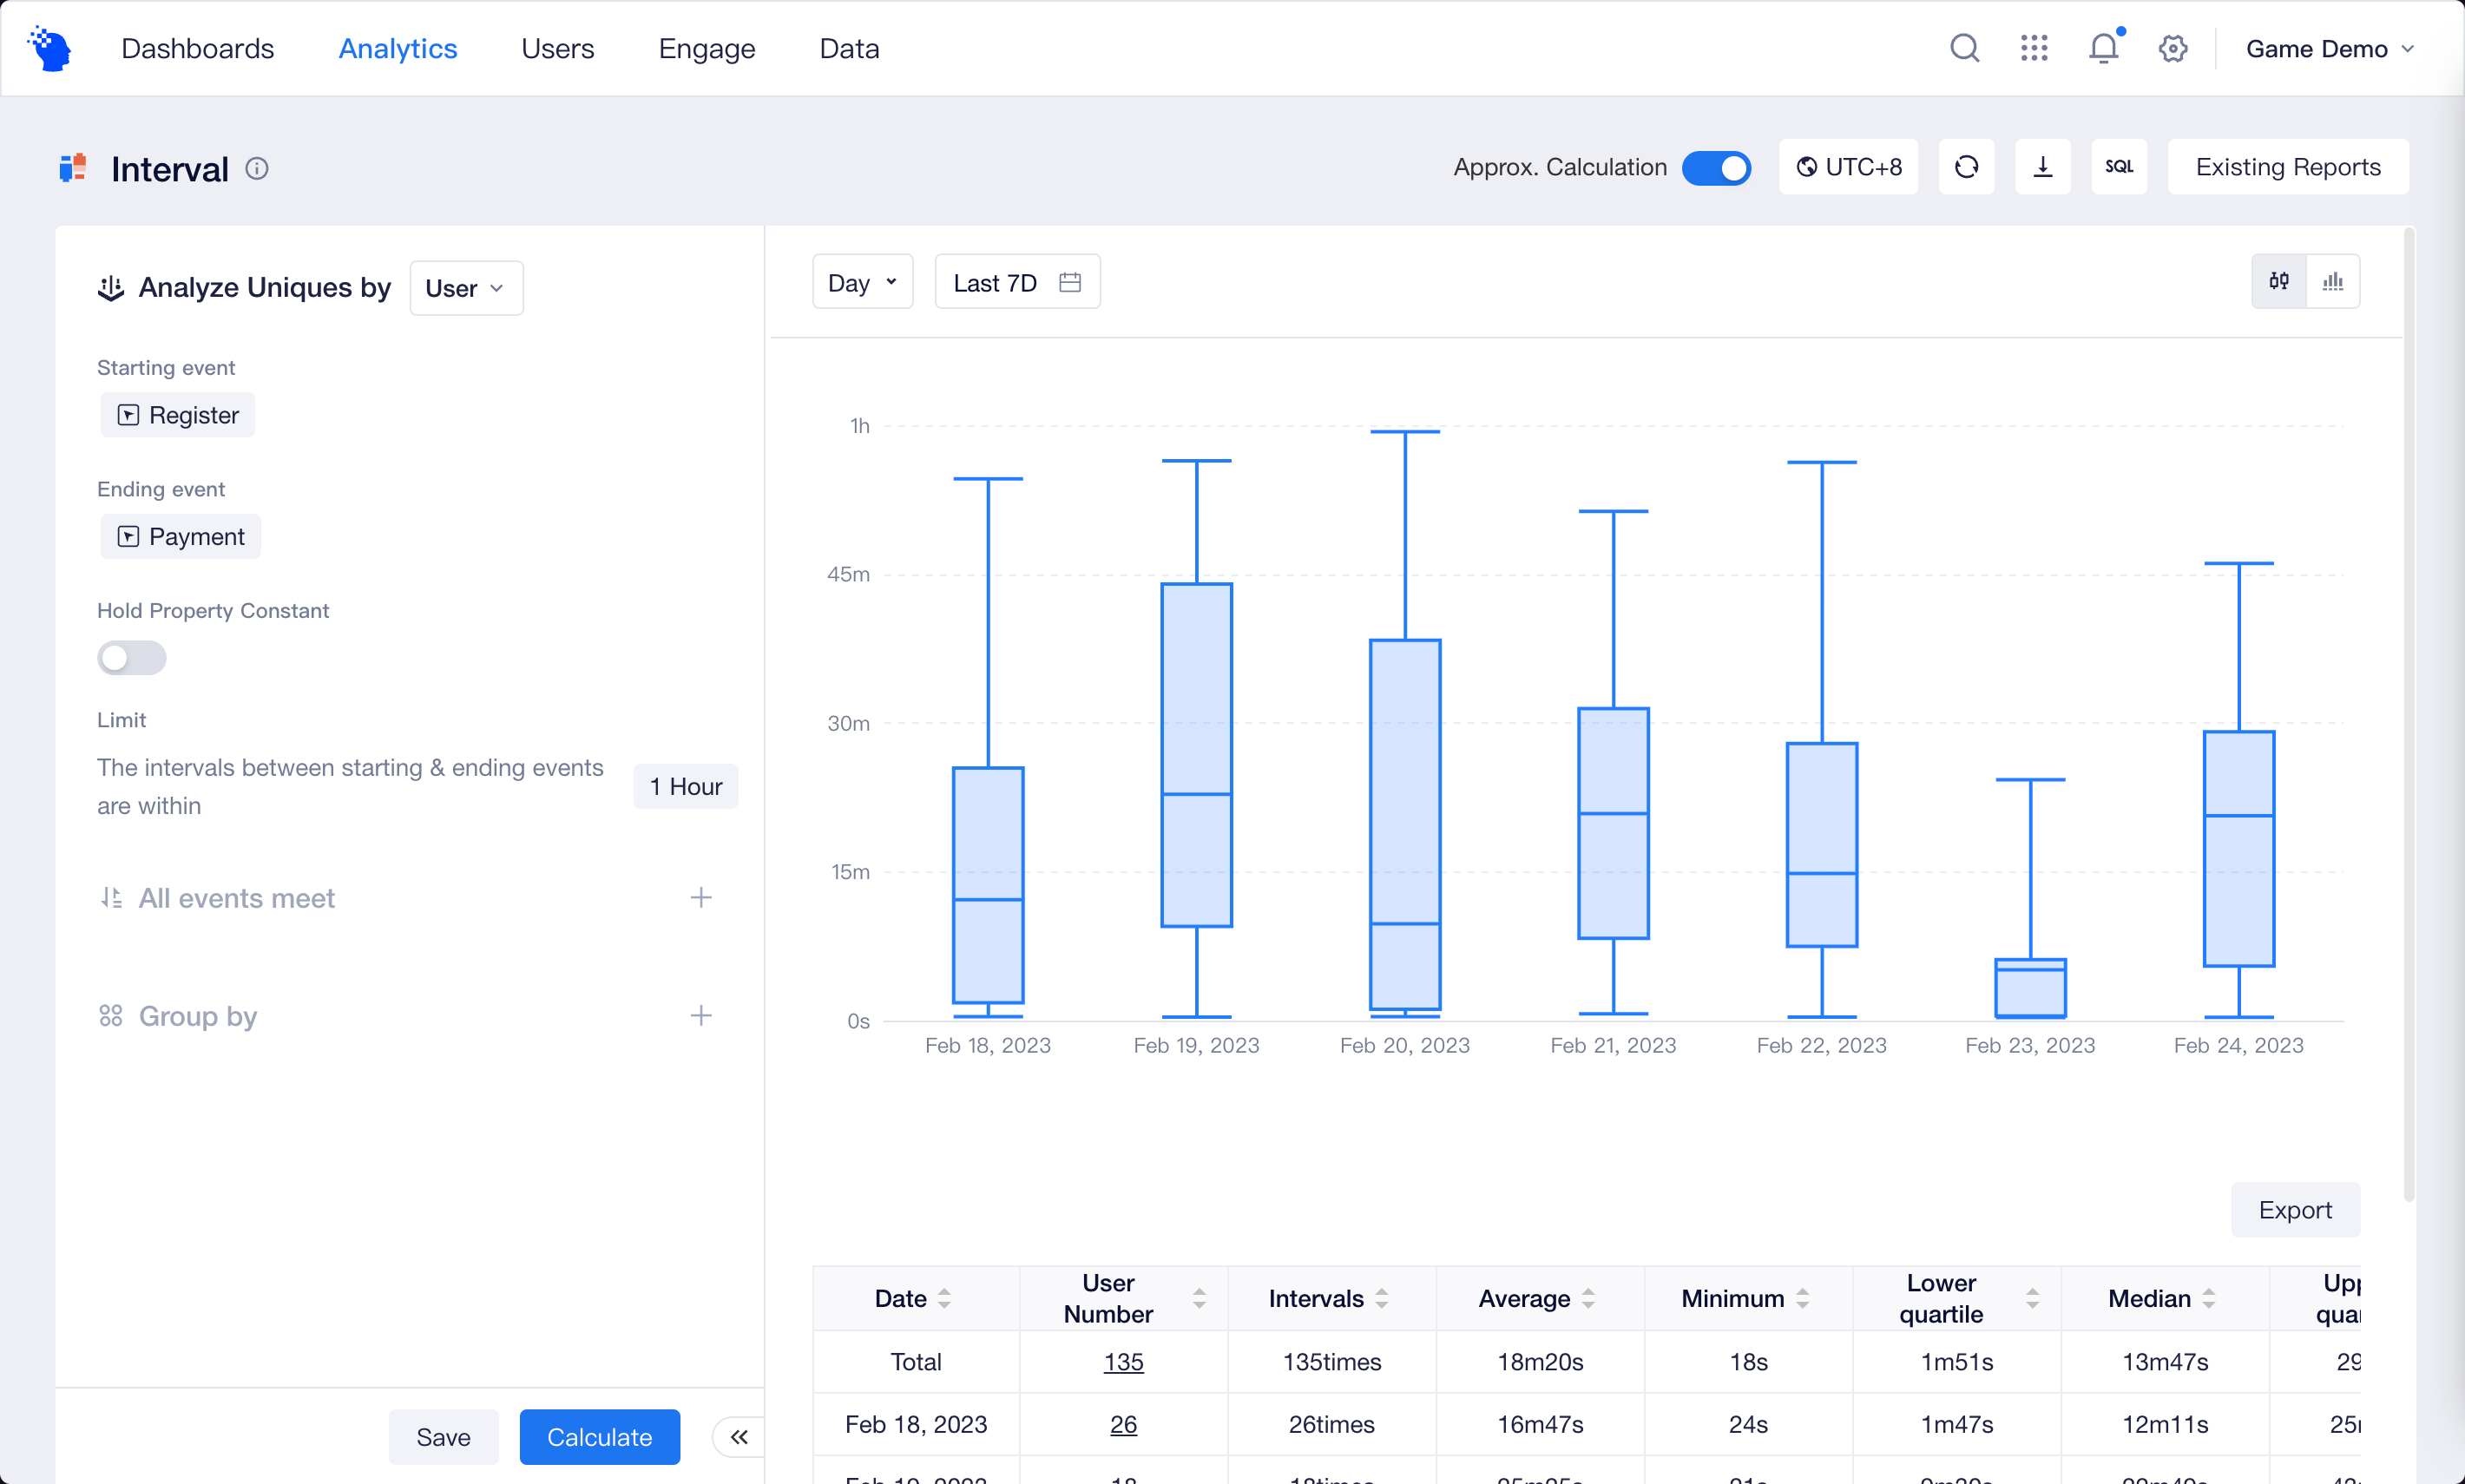
Interval can help you analyze the time that users spend from registration to ice-breaking payment and intuitively view medians and upper and lower quartiles from boxplots, thereby providing evidence for the adjustment of first payment points.
# User property analysis
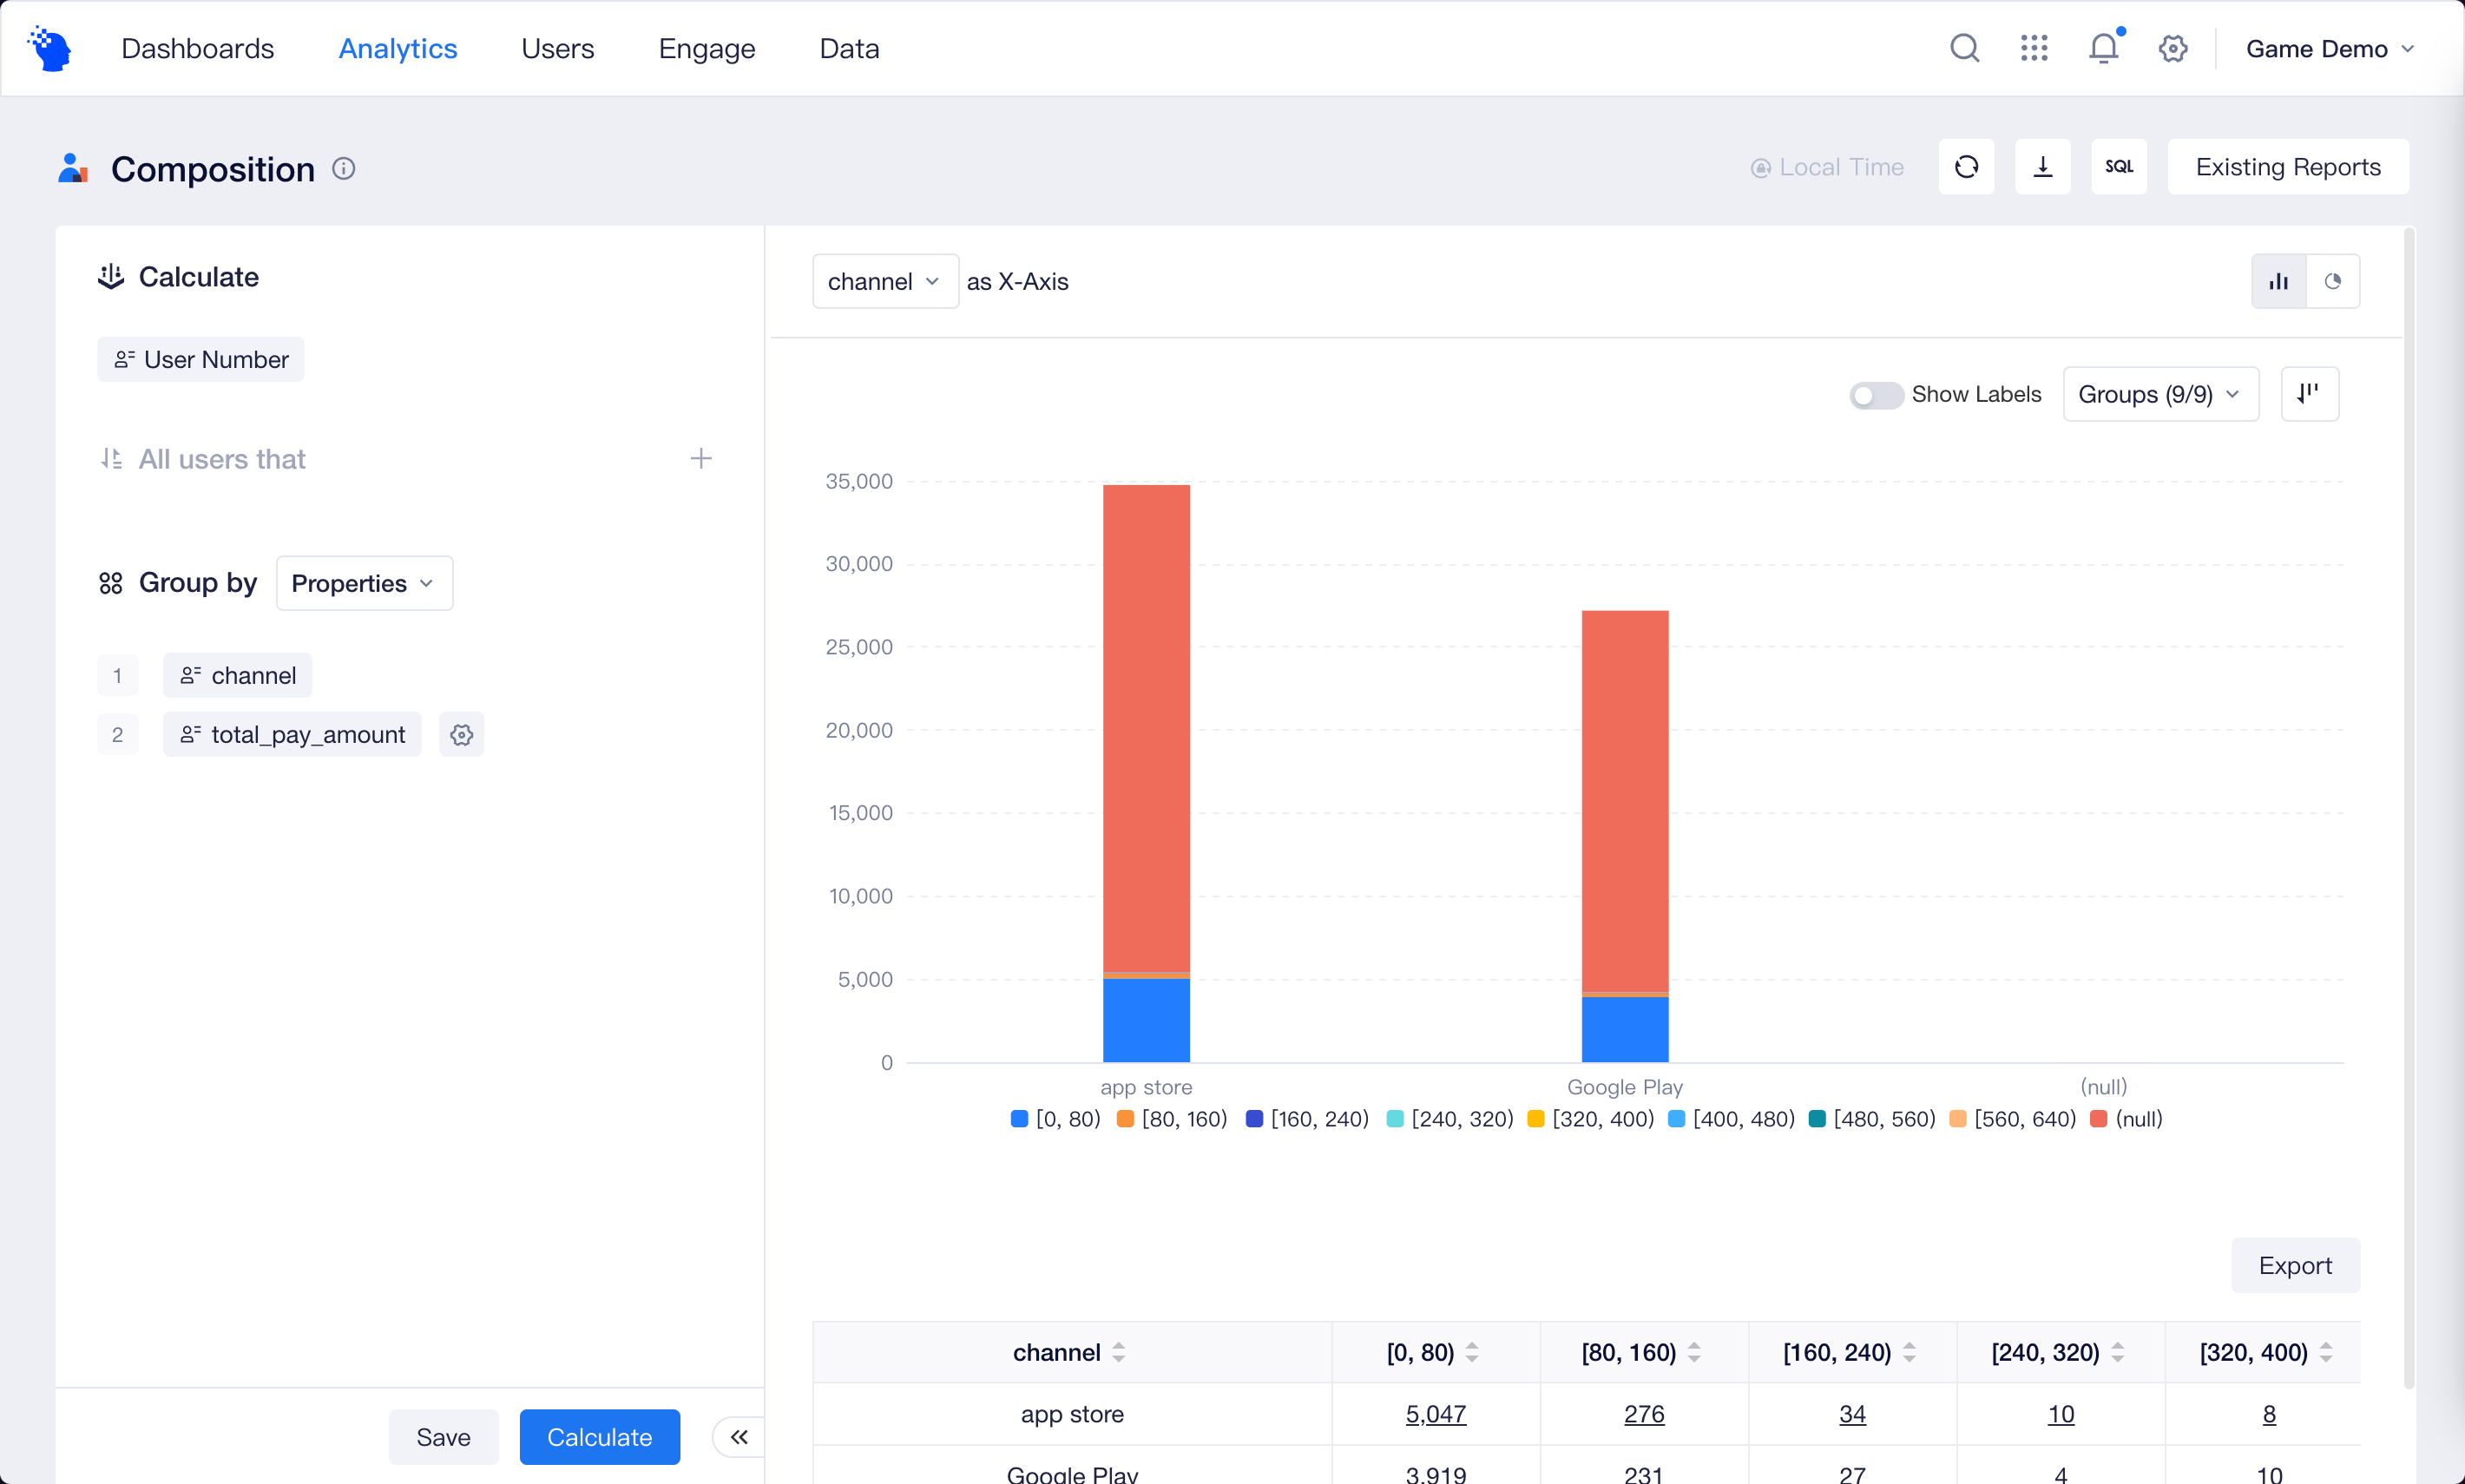
You can perform dimensional crossover combination in Composition to see the number of users corresponding to the combination and detect whether there is any correlation between two dimensions. For example, using source channel and cumulative payment amount as group-by items, you can find whether the percentage of large payers from certain channels is larger than those of other channels.
If you find any exception with the number of users from certain dimensional combination, you can click to access to User List or further go to User Behavior Sequence to observe all properties of individual users. You can also divide users within a project into different groups based on user properties and compare their data performances.
If the current user properties cannot satisfy your needs, you can also stratify users by Tags, which can be applied in the same way as user properties to filter and group-by items.
When there are a large number of properties in the project, you can place multiple property analysis reports on one Dashboard to construct complete user portraits.
