# Sharing Dashboard
You can share dashboards or a batch of dashboards through TeamSpace. In addition, you can also push data to relevant personnel at a pre-set time through Dashboard Digest.
# Share dashboards
By default, dashboards created under "My Dashboard" are visible only to the creator. After creating a dashboard, you may add other members of the project as dashboard viewers or editors as a way to share the dashboard within your team.
# Select member/team
Click the "Share" button at the upper right corner of the dashboard to share the dashboard.
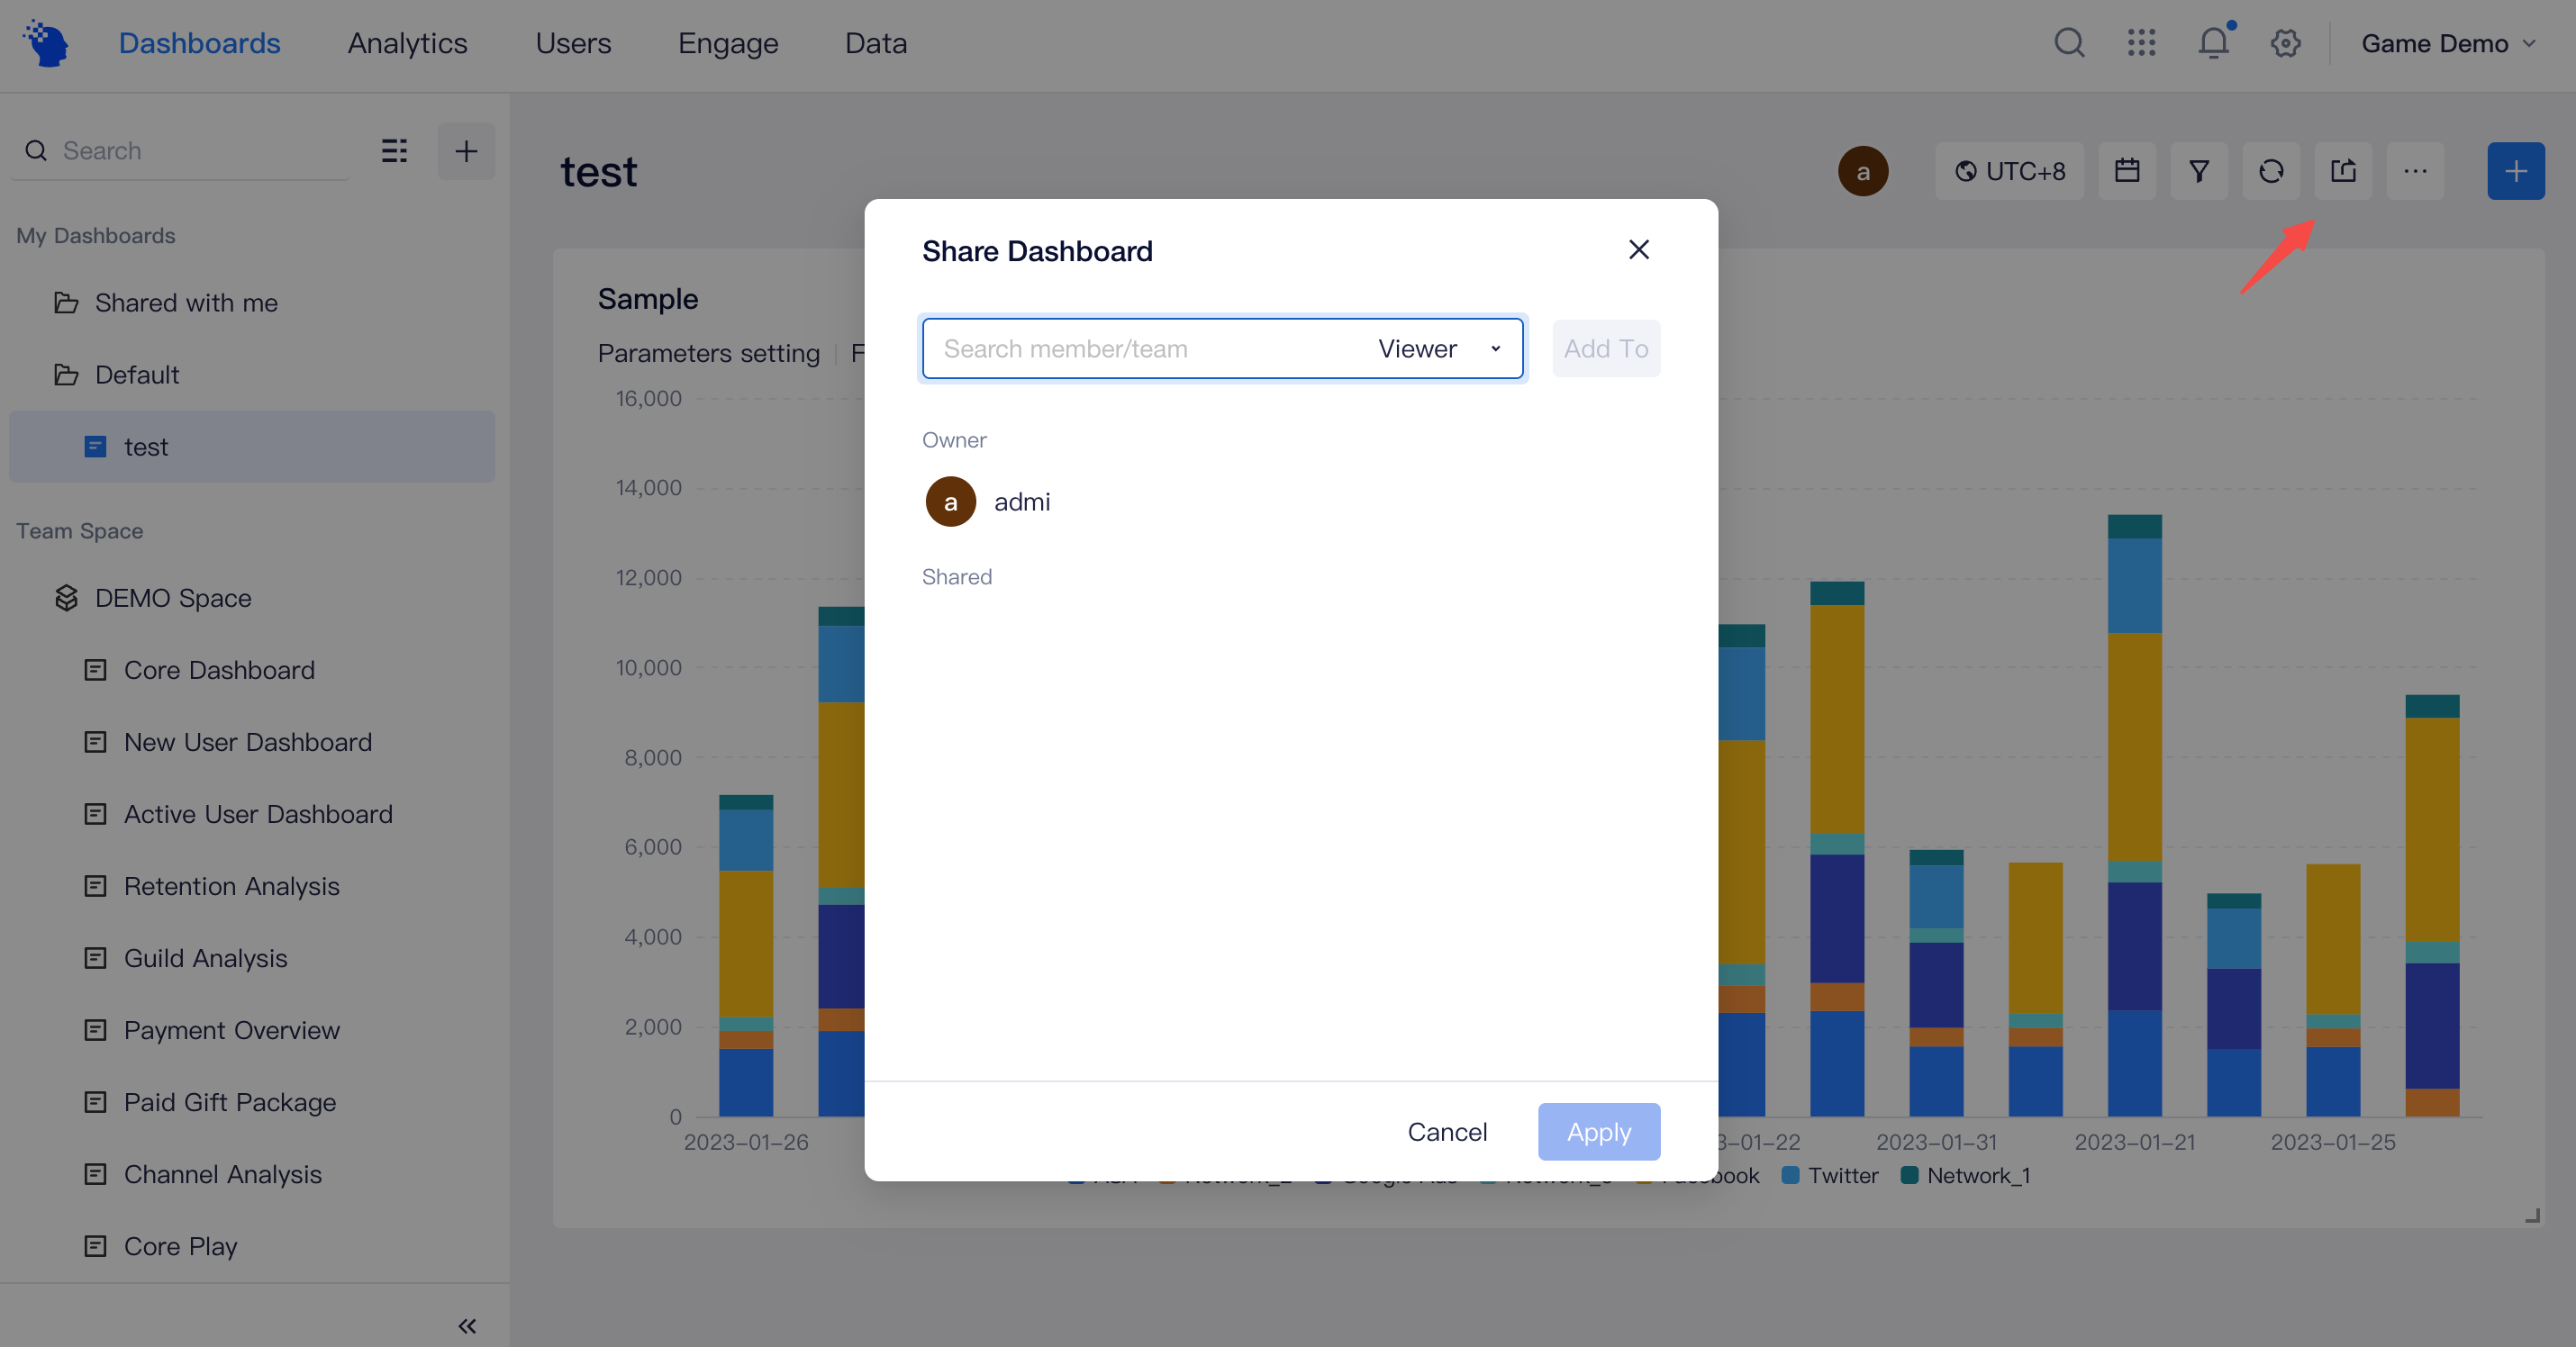
By default, the dashboard is visible only to yourself. You can share the dashboard to:
- Project: Visible to all members of the project
- Team: Visible to all members of the team
- Designated members: Visible to designated members
# Set viewers or editors
Depending on your actual needs, you may set members as dashboard viewers or editors:
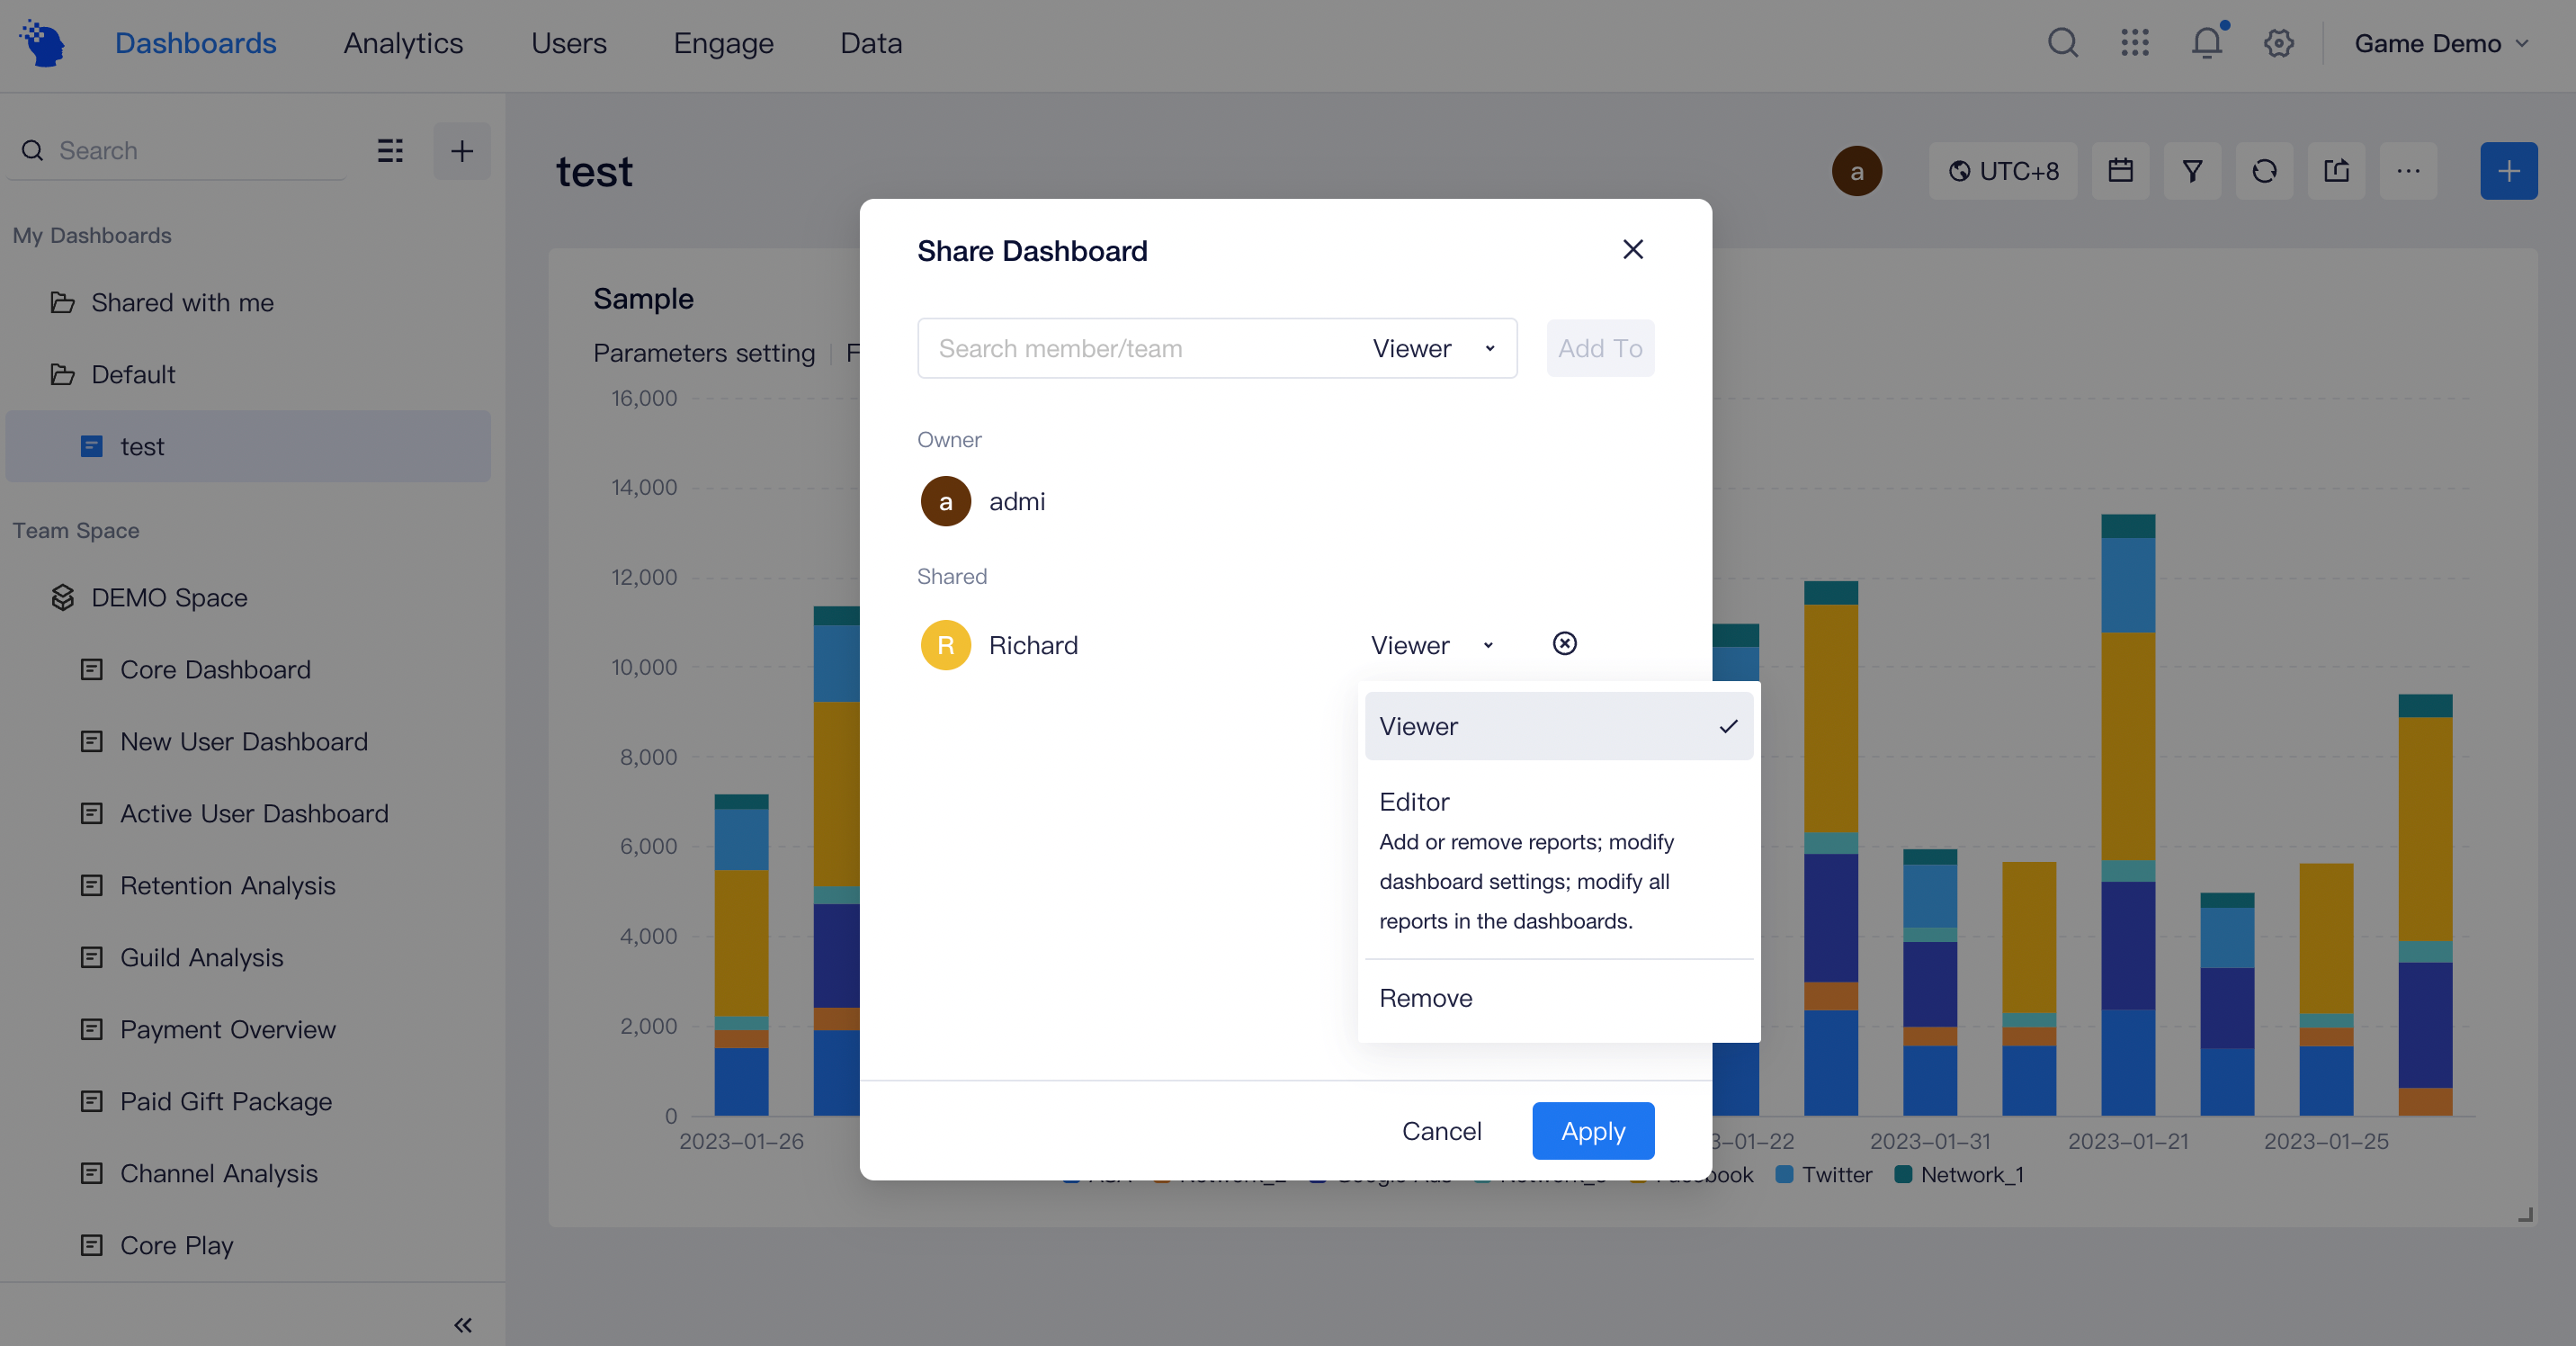
- The viewers only have the permission to view the dashboard without being able to edit dashboard content and displays.
- Apart from viewing the dashboard, editors can perform the following operations on the dashboard:
- Add or delete modules on the dashboard
- Modify dashboard reports and their displays
- Edit dashboard settings (including update mode,approx. calculation and fixed timezone settings)
- View sharing status of the dashboard
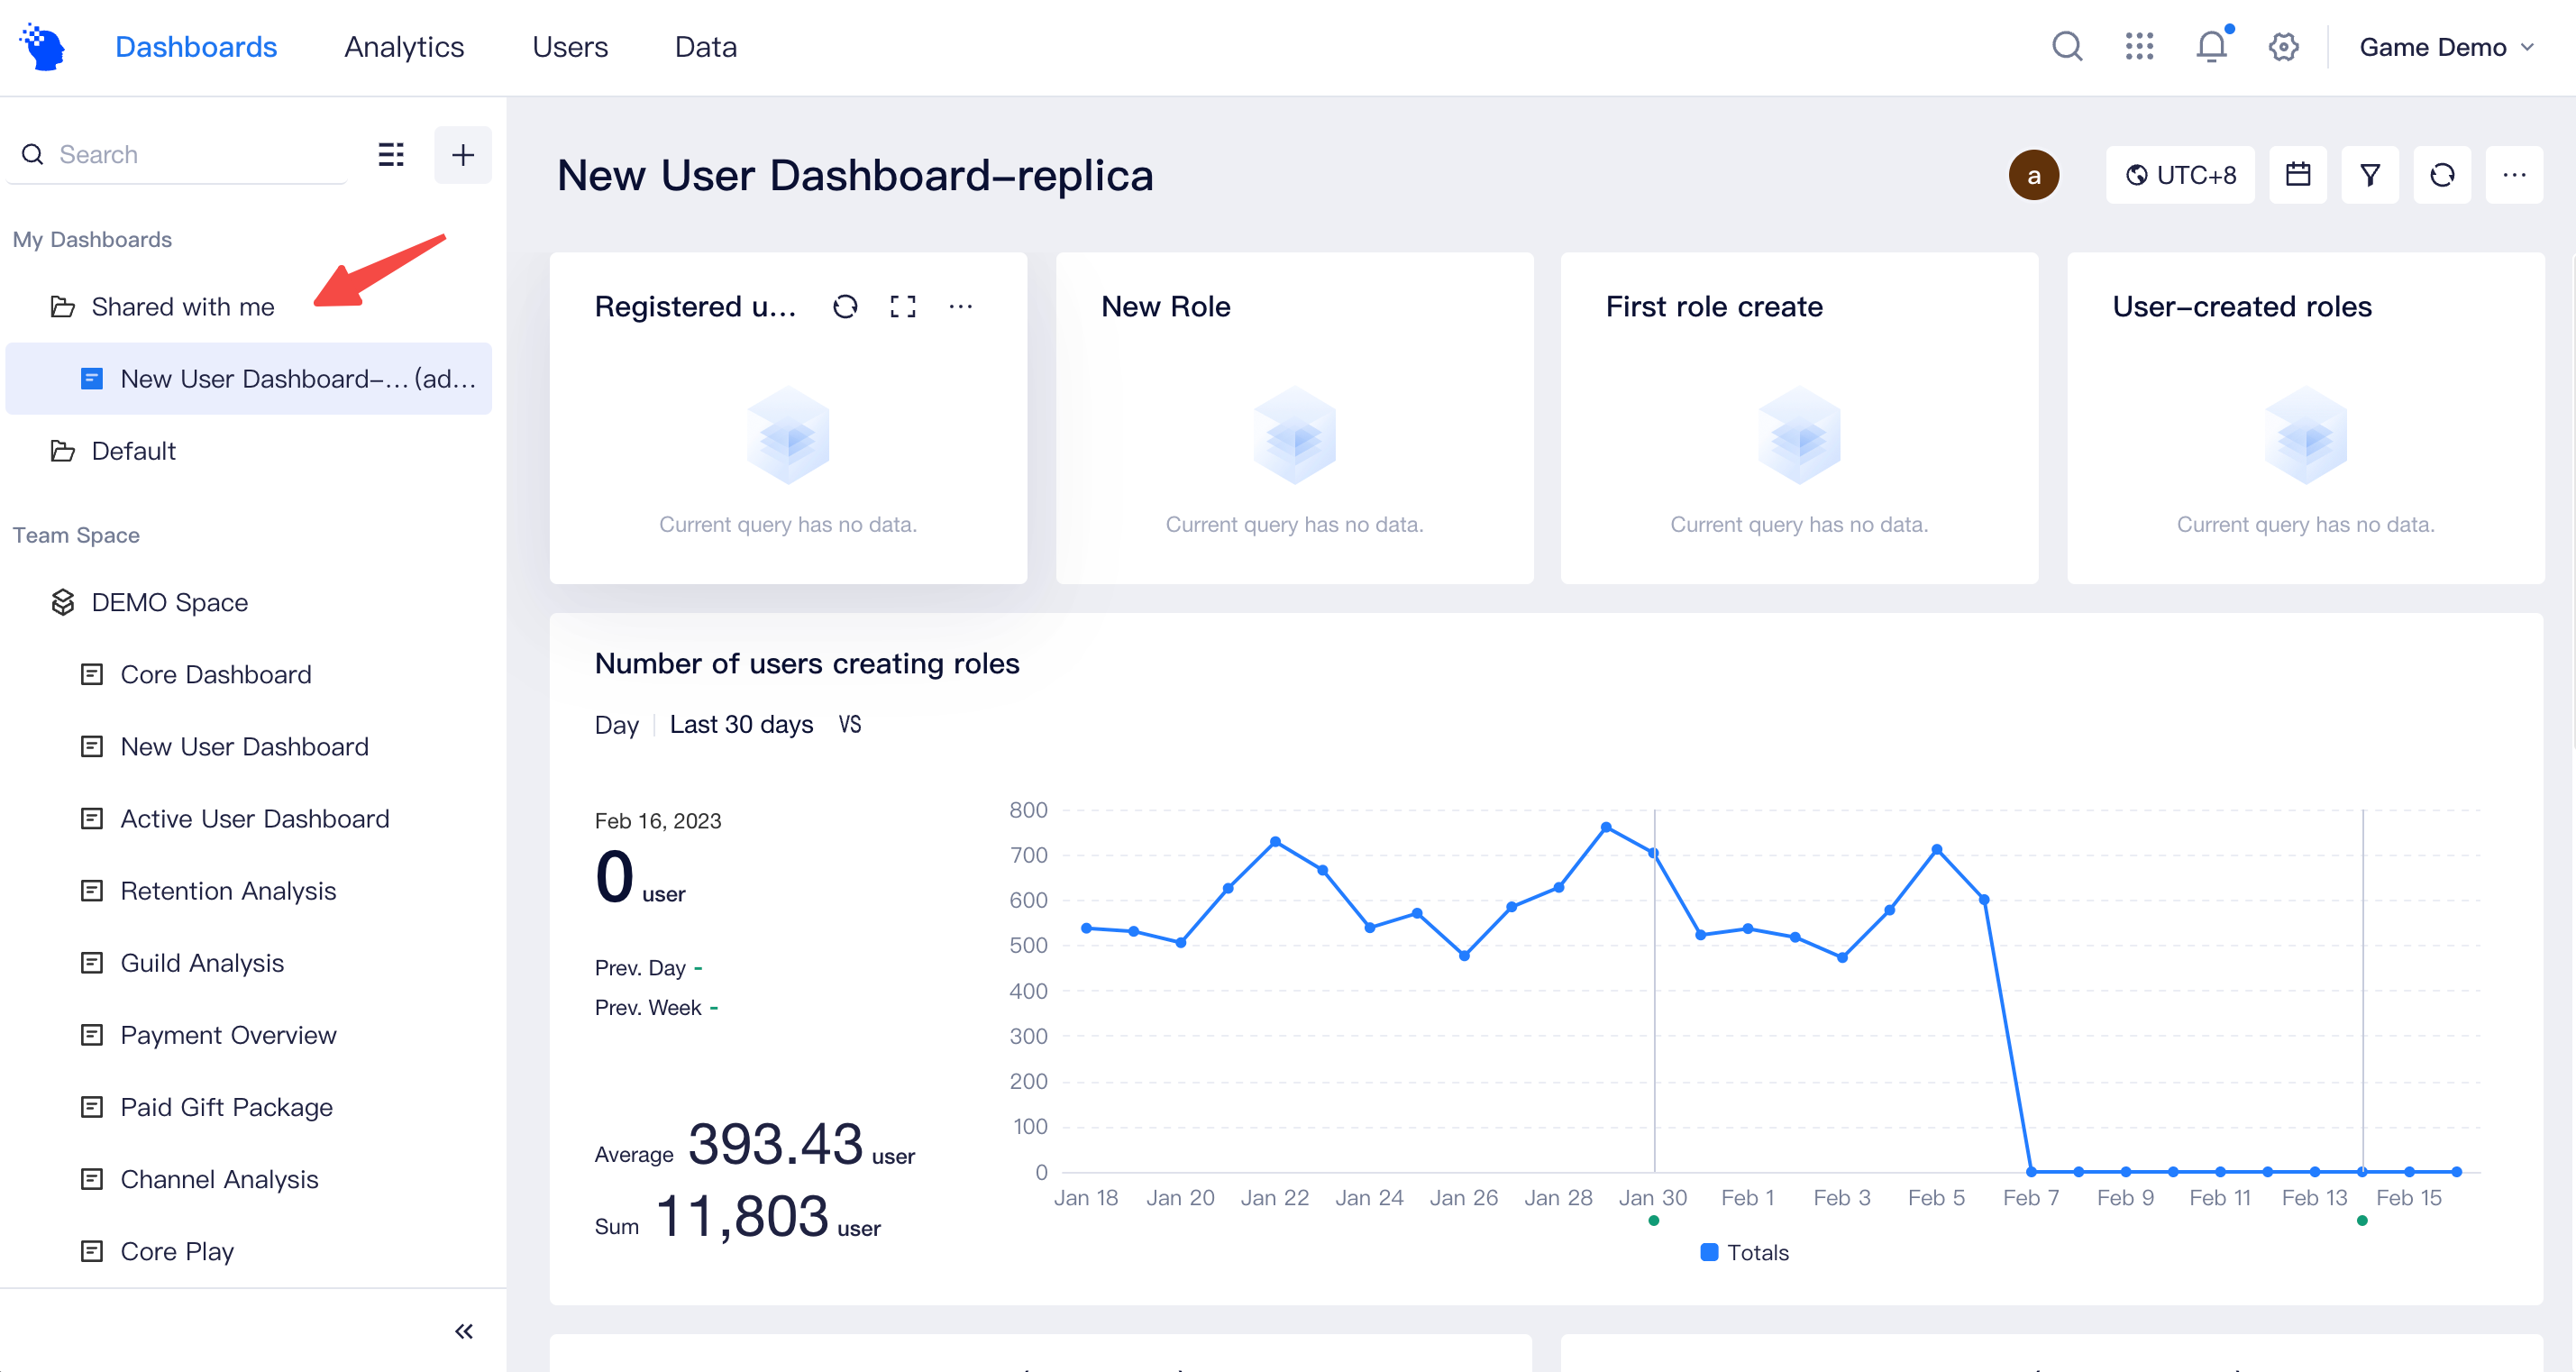
After sharing, members may view the dashboard from the folder of "Shared with me".
# Sharing by Team Space
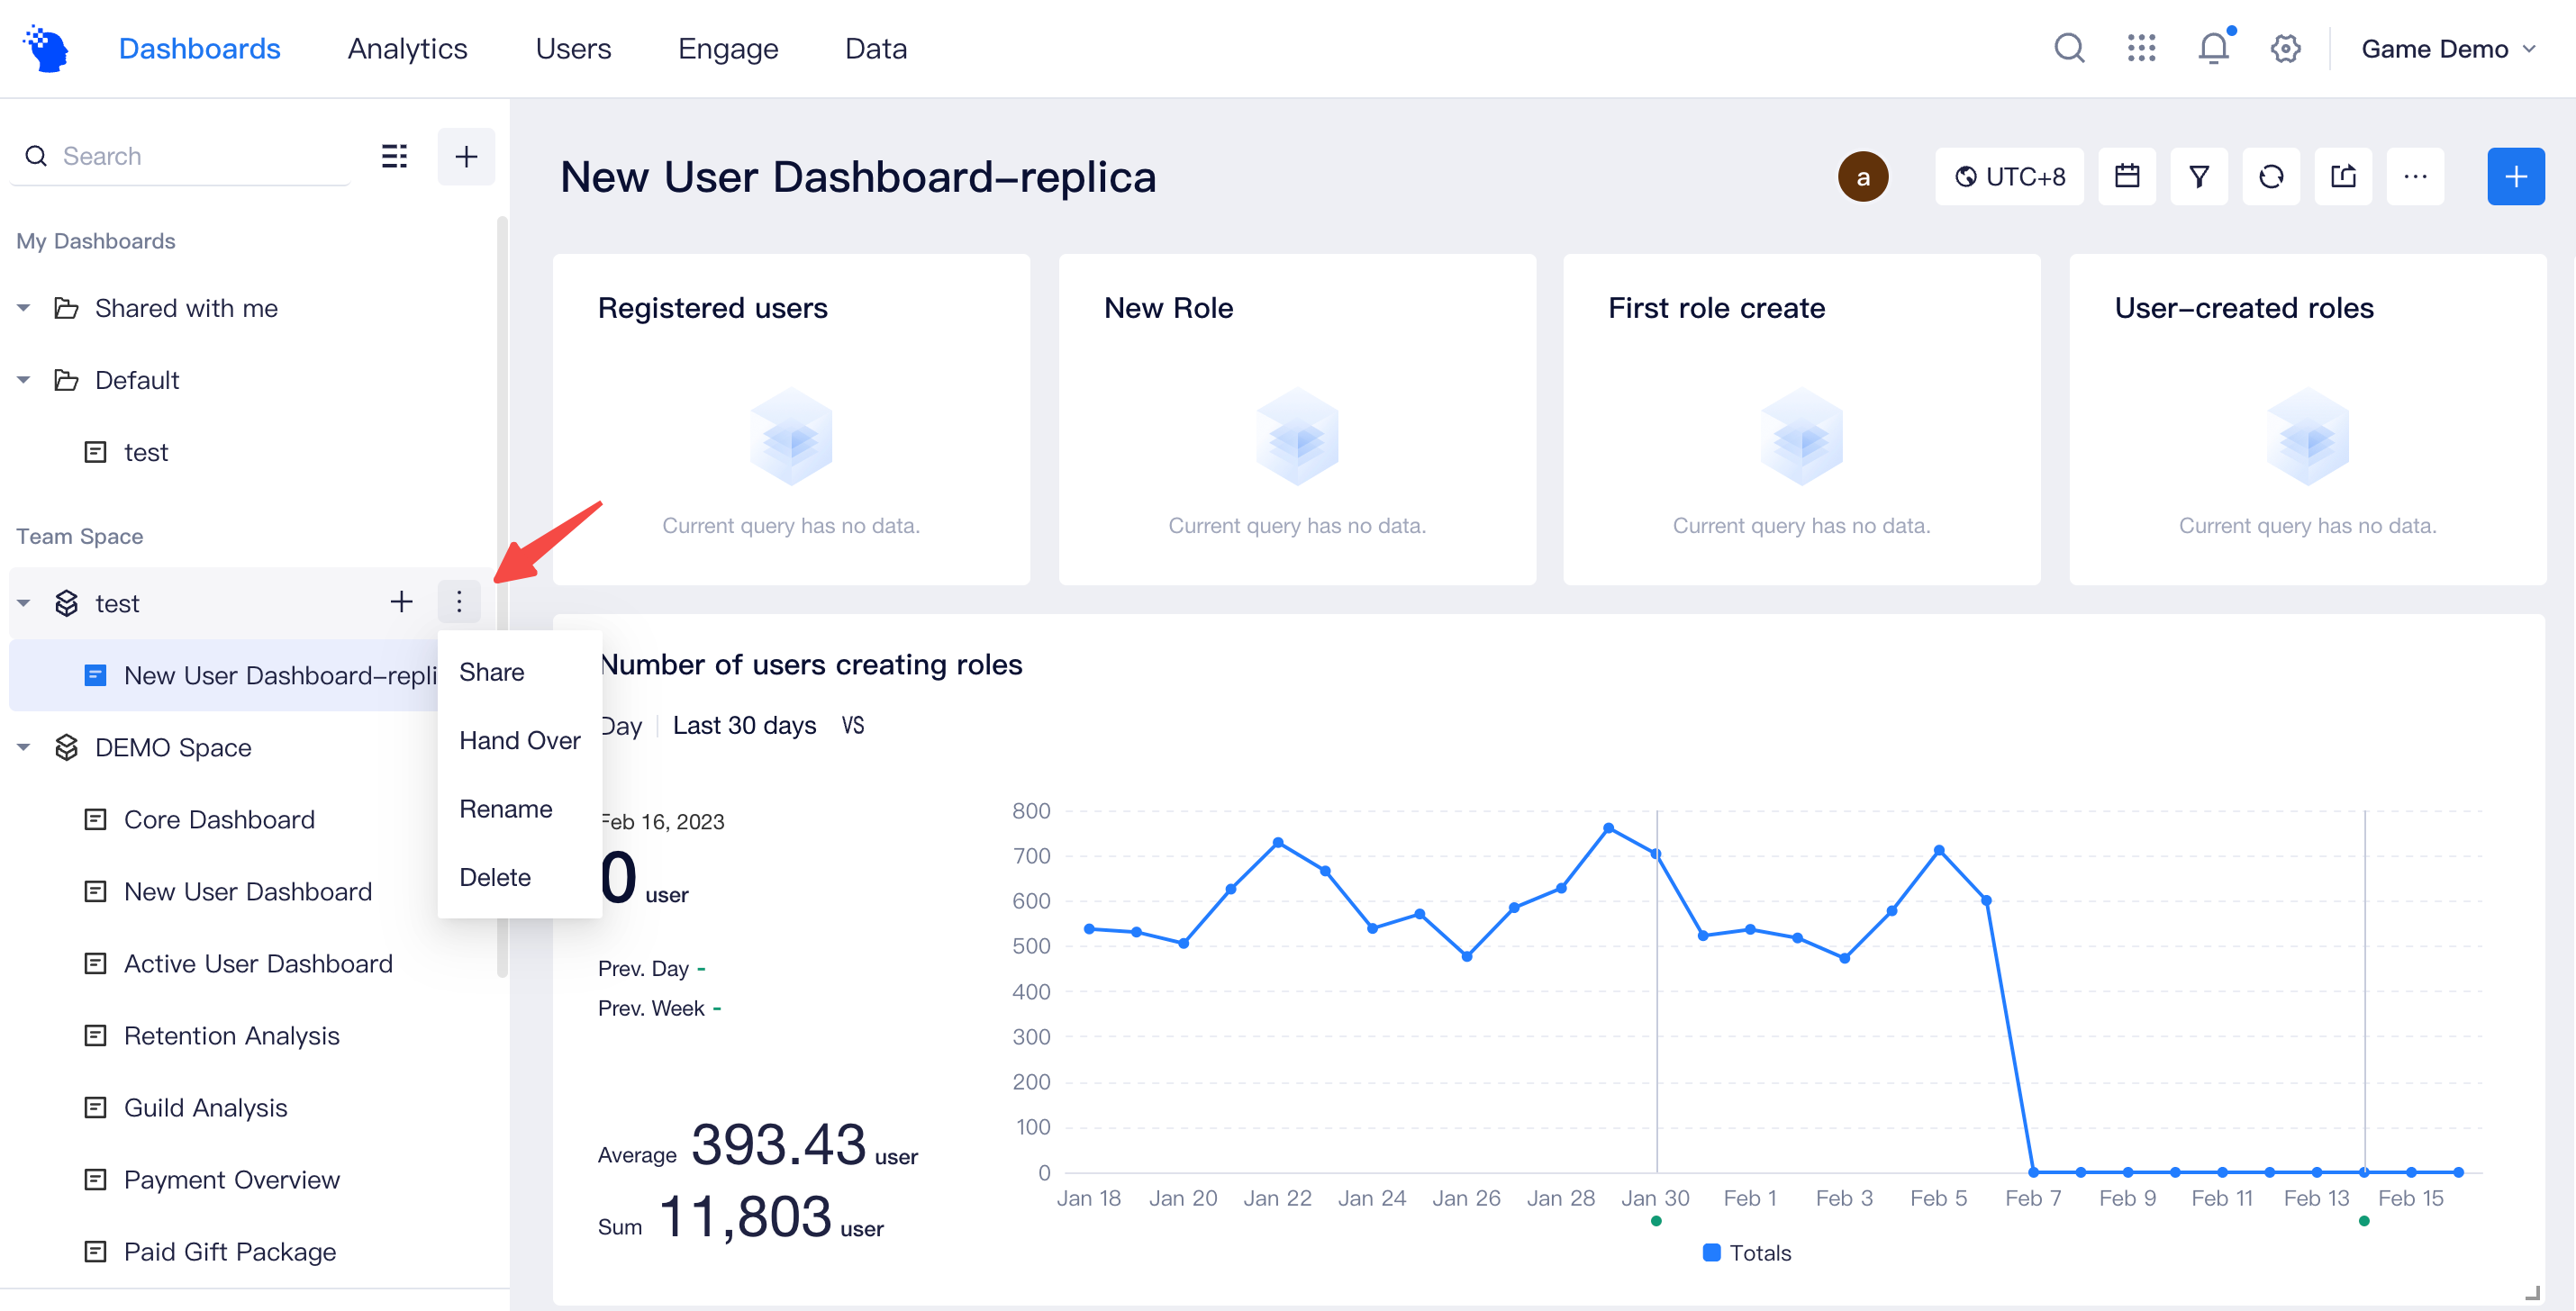
In case of multiple dashboards, managing dashboards from My Dashboard can create a challenge for sorting out dashboards or co-viewing among team members. In this case, you can create a team space, add space members and then organise dashboards within the space.
- By default, dashboards within team space are visible to all space members.
- Members having the "Viewer" permission can only view all dashboards within the space.
- Members having the "Editor" permission can edit all dashboards within the space, and create new dashboards or folders within the team space.
For a specific dashboard within the space, you may also click "Share" on the upper right corner of the dashboard to share it with other members. This operation will enable a non-space-member to view the dashboard from the "Shared with me" folder.
# Dashboard Digest
You may use the dashboard digest feature to push dashboard data at a scheduled time to mailboxes or third-party tools like enterprise WeChat, Dinging and Feishu.
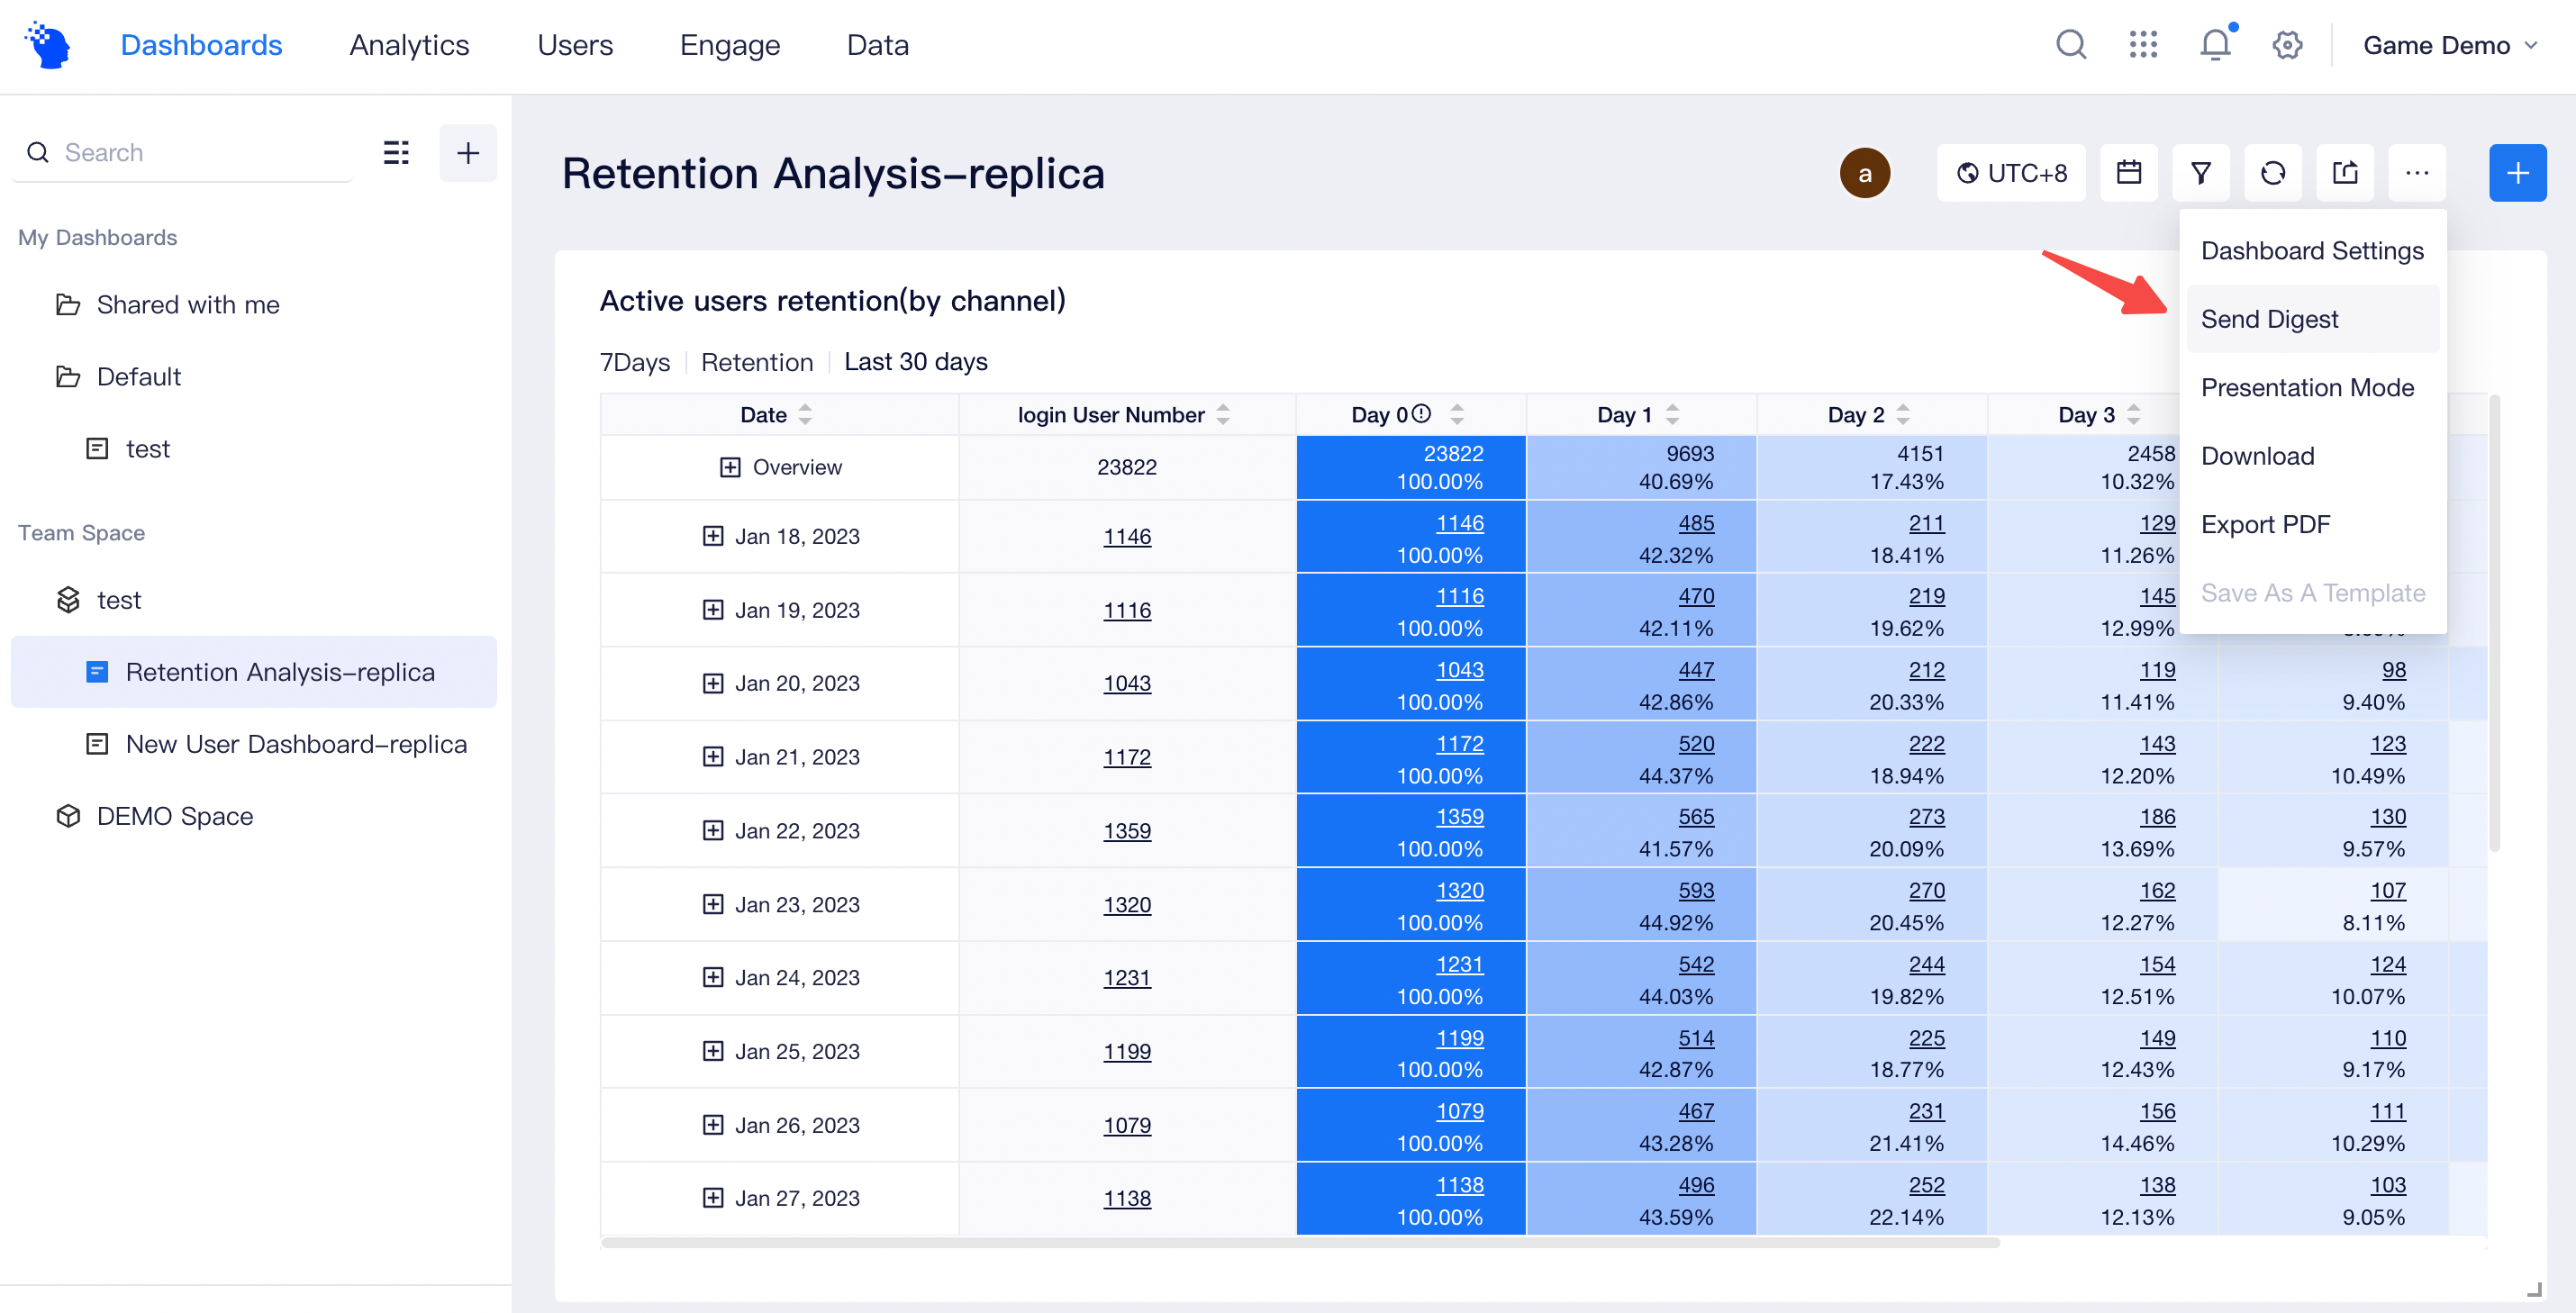
# Settings
Send mode
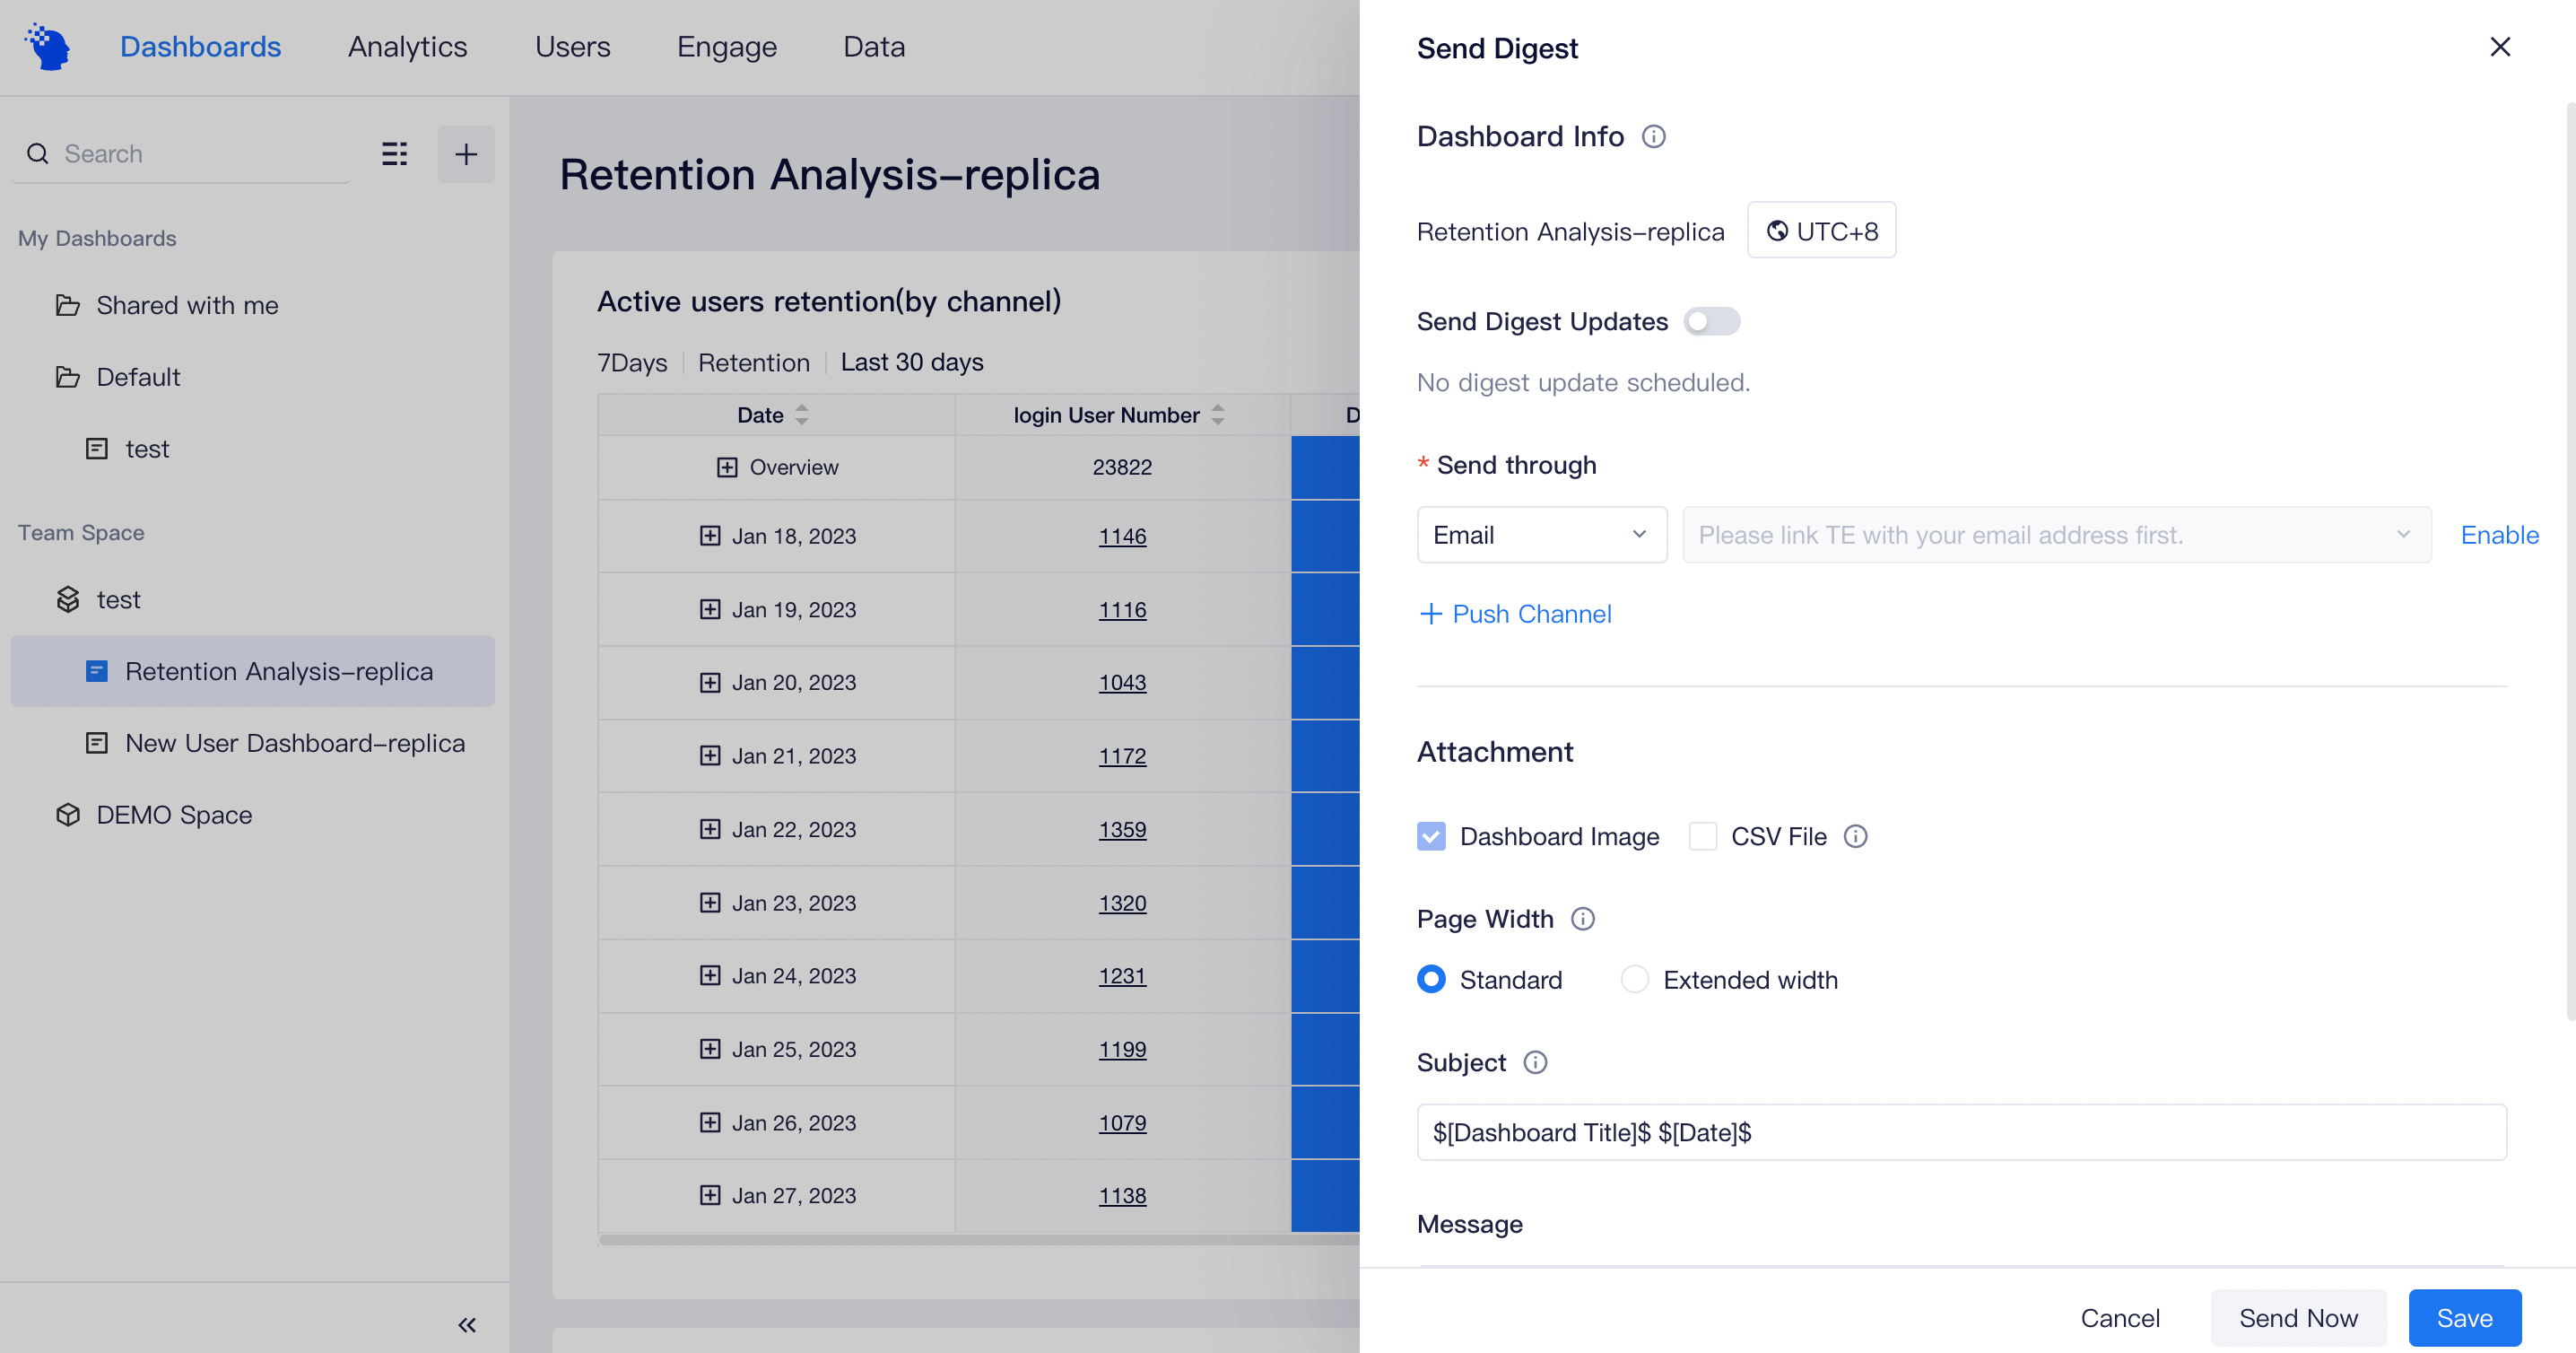
You may select "Send Digest Updates" or "Send Now" to push dashboard content.
- When periodical push of dashboard content is required, open "Send Digest Updates" and select push frequency and times, which supports push on a daily or weekly basis.
- If scheduled push is not needed or if you wish to check out the push results, you may click "Send Now" after completing push settings.
Send through
- Mailbox
To implement mailbox push, the dashboard creator should first bind mailbox information at "Personal Center → Account Settings".
By default, mailbox push only supports pushing dashboard to project members whose mailboxes have been bound. If your system has enabled the SMTP email push service, then you may also add external email addresses. To bind the SMTP service, please see Email SMTP Configuration.
- Third-party tools
include enterprise WeCom Bot, Dingtalk Bot and Feishu Bot. To acquire the webhook addresses of these bots, please see:
- WeCom Bot URL (opens new window) (opens new window)
- Dingtalk Bot URL (opens new window) (opens new window)
- To push image and text content, Feishu Bot requires verification of APP ID, APP Secret and Webhook addresses, which is accessible at URL (opens new window) (opens new window).
Push content
- By default, push content contains dashboard images. For dashboards involving many tables, you may select "Extended width" under "Page Width". Under the "Extended width" mode, dashboard will be pushed at a 1.5 times of the standard screen size to display more information at the horizontal direction (supporting full display of a wide table of event analysis report consisting of 15 columns).
- You may select whether to push the CSV file of the dashboard data. CSV files can be pushed from the following two modes:
- The CSV ZIP file, which is pushed when the CSV file is smaller than 30M and the system has been configured with the SMTP service.
- The download URL of the CSV file along with the fetch code. The original CSV file can only be downloaded after entering the correct fetch code and the download URL will become invalid after 30 days of its generation. Download URLs will be pushed in the following scenarios:
- Push is implemented via Enterprise WeChat, Dingding and Feishu bots;
- Maillbox push without SMTP service;
- CSV file size is larger than 30M despite the availability of SMTP service.
- Copywriting content to be pushed is comprised of the title and main body, which can be respectively customized. Custom copywriting content supports the use of 4 substitute characters: $[Dashboard Name]$, $[Date]$, $[Date of Yesterday]$ and $[Dashboard Time Computation]$, which will be automatically bring in new information when push is performed.
- If a dashboard push involves the "date annotation" information of the project, then all time and annotation content related to date annotation will be fully displayed on the image footnote.
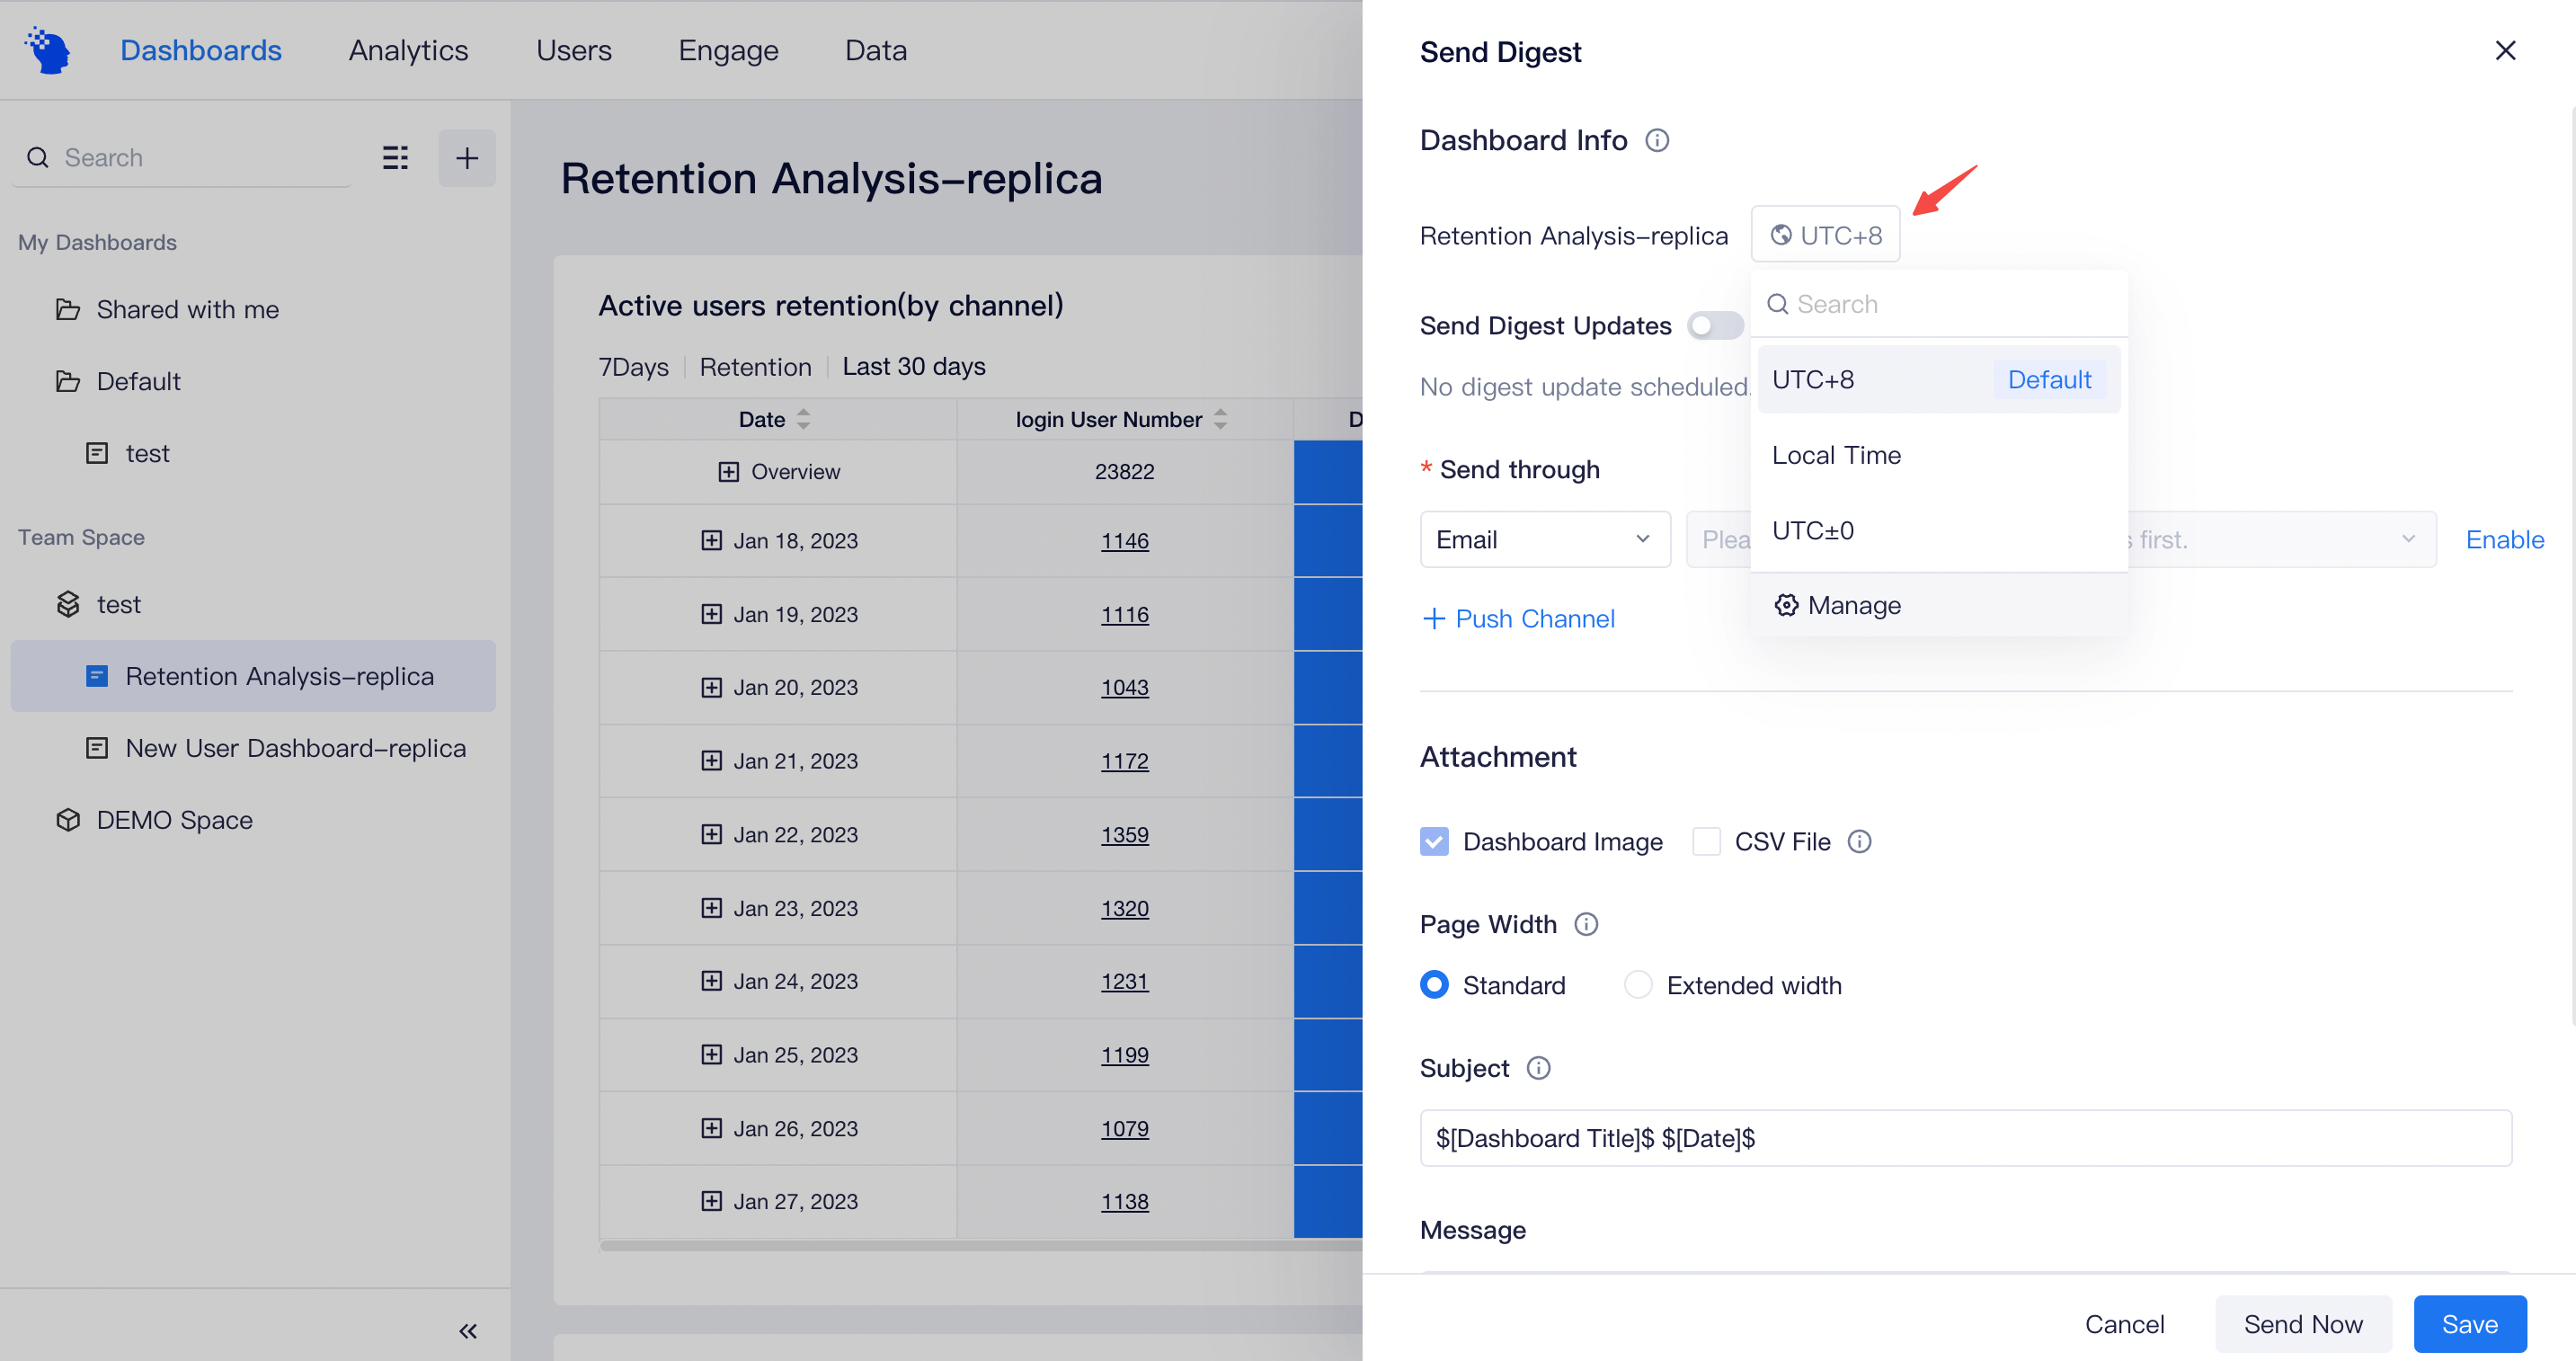
# Computational logic
A scheduled push of dashboard executes a computation before push is executed. The computational rules for data push are as follows:
- Timezone: Computed as per the specified timezone in push settings
- Data permissions: Computed as per data permissions of dashboard creator
- Filter status: Computed as per default filter status of the dashboard
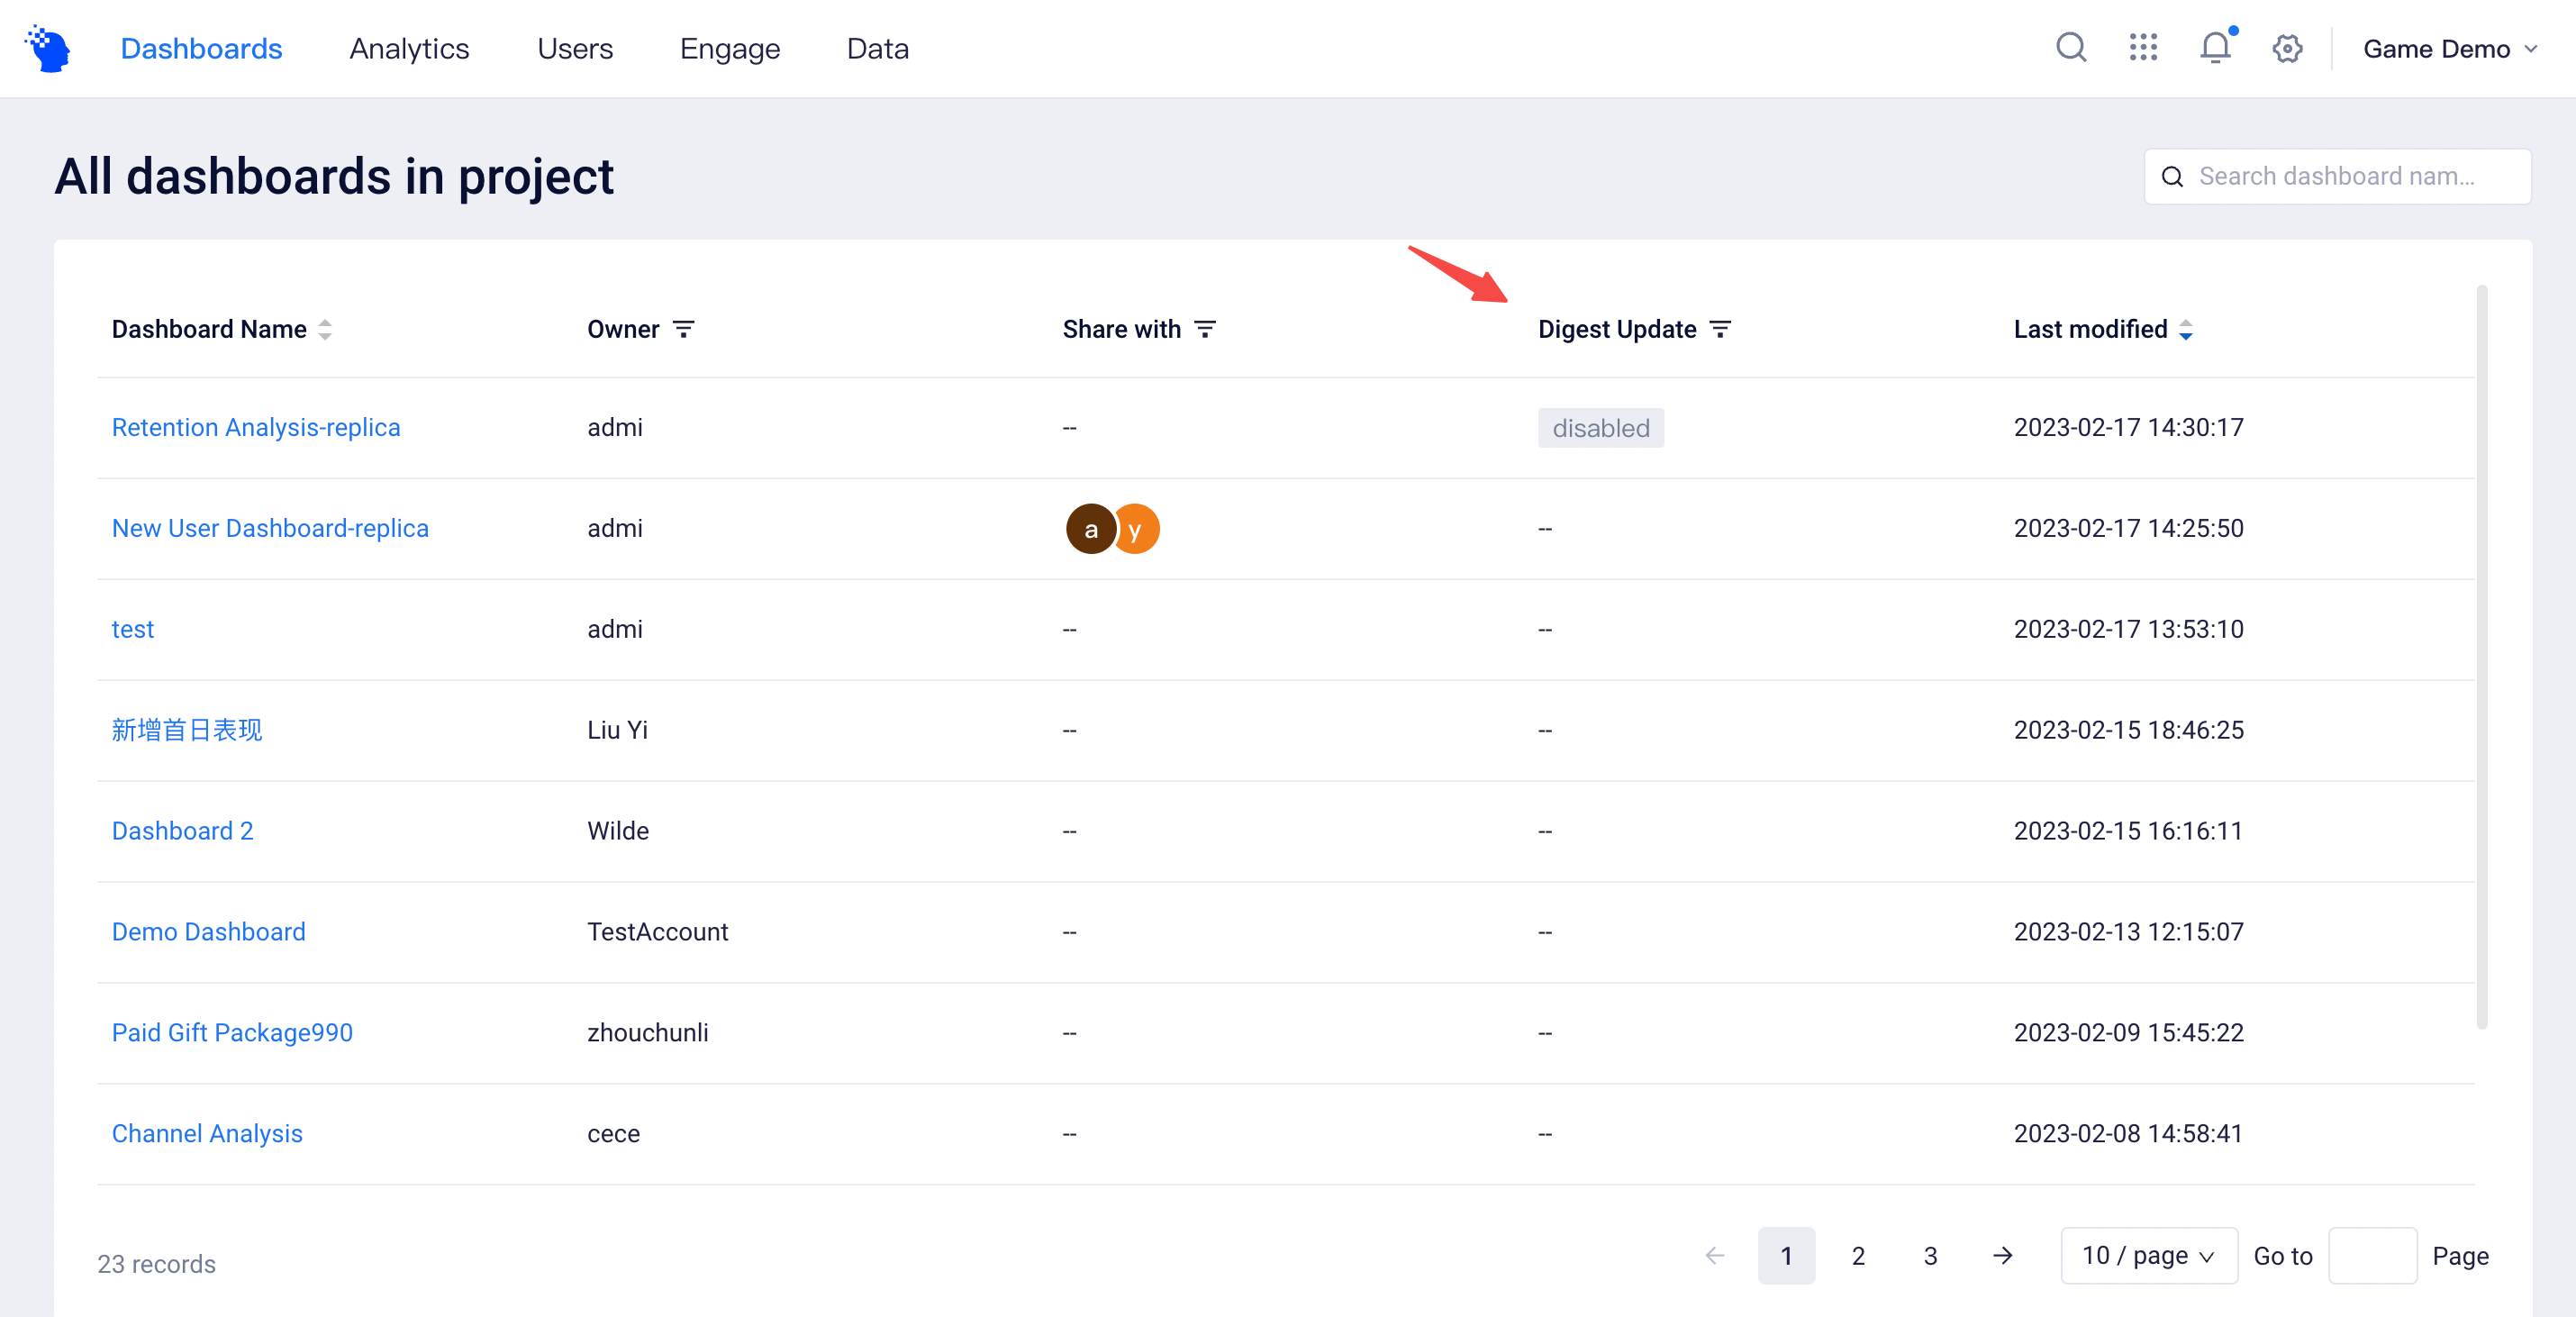
# View push status
You may view the progress and status of Scheduled Push and Instant Push either completed in the past 24 hours or ongoing Tasks.

System Root may also view push status of different dashboards at Dashboard Management → All Project Dashboards, where you can decide whether to enable Scheduled Push or information about the target channels of the push.
In case of a push failure, you may select to retry from the list. In case of any channel errors (including errors about channel information and mailbox binding service becoming invalid), you need go to the push settings page to adjust relevant information before retrying to send the dashboard manually. A channel error will prompt the return of an error code utilized by the channel, which can be used to check against the official document to locate the problem. To view the error code, please hover the mouse cursor over "Task Failure".
- For error codes of Feishu, please see: https://open.feishu.cn/document/ukTMukTMukTM/ugjM14COyUjL4ITN
- For error codes of Enterprise WeChat, please see: https://open.work.weixin.qq.com/devtool/query
- For error codes of Dingding, please see: https://open.dingtalk.com/document/orgapp/custom-robot-access#6a8e23113eggw
The causes of other common errors, such as failure to generate daily reports, may include, but not limited to, error during chrome installation after scaling and migration and dashboard loading timeout. In these cases, you should contact O&M personnel to identify problems.
#
# Permissions about shared dashboard
Permission details | Root | Project Owner | Analysis Admin | Analyst | Regular Members |
|---|---|---|---|---|---|
Set dashboard sharing and collaboration | ● | ● | ● | ▲ | △ |
Push self-created dashboards to mailboxes and bots | ● | ● | ● | ▲ | △ |
Create space and set space members and permissions | ● | ● | ● | △ | △ |
Import/Export dashboard configurations, and copy self-created dashboards or dashboards created by others. | ● | ● | ● | ▲ | △ |
Notes on permissions:
● Compulsory availability for roles
△ Availability by default for roles, but unavailability is allowed
△ Unavailability for roles by default, but availability is allowed
○ Compulsory unavailability for roles