# Creating a Dashboard
When you need to simultaneously view data reports of multiple metrics on the same page under a certain analytical theme, you may create a dashboard. A dashboard consists of analysis models such as Event, Retention, Funnel, Distribution, Interval, Flow, Composition and SQL IDE, as well as User Tags, which can all be saved as reports and placed on the dashboard.
When you have added reports to a dashboard, you can add a note to describe the reports on the dashboard; or, you may also add a page filter to provide dashboard viewers with a convenient data filter capacity.
# Creating a New Dashboard
# Directly Creating a Dashboard
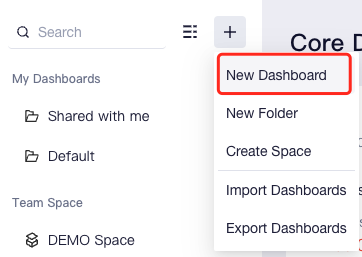
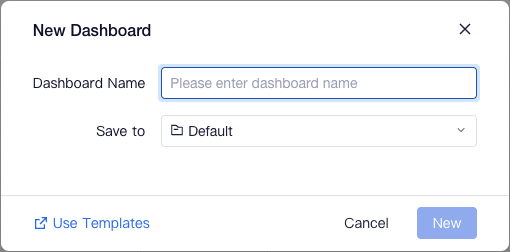
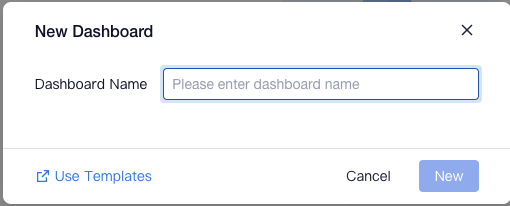
Select Create Dashboard from the "+" button on the right of the Dashboard List, and place the new dashboard in My Dashboard or Project Space. After that, a dashboard is created.
Dashboards placed in "My Dashboard" are usually intended for viewing personal data; if you want your team to view dashboards under certain themes in a uniform and structural manner, placing dashboards in "Project Space" would be a better choice.
Newly created dashboards can be renamed, copied, moved and deleted.
# Creating New Dashboards Using Other Methods
# Copying a Dashboard
If you want to create a dashboard with a theme similar to the previous one, you can use the "Copy Dashboard" feature.
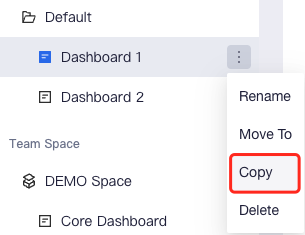
Click "..." on the right of the dashboard name at the Dashboard List and then select "Copy" to copy the dashboard and specify a new location for the copy.
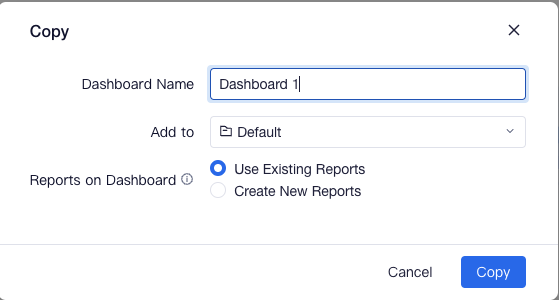
When copying a dashboard, you may choose to refer to or copy the reports of the dashboard in the copy. TE supports the utilization of the same report by multiple dashboards, which is also the case of Use Existing Reports; however, when using Create New Reports, a batch of identical new reports will be created. "Use Existing Reports" is available only for the creator and collaborators of the dashboard.
# Importing a Dashboard
You can copy the dashboard of a project to other projects using the Import & Export feature. It should be noted that for projects involving exporting or importing a dashboard, the definitions of their events and properties should be matched. That is, there must be the same data tracking structure between the two projects in order for the imported dashboard to work properly.
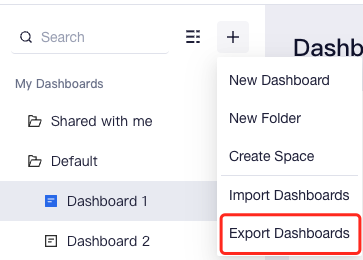
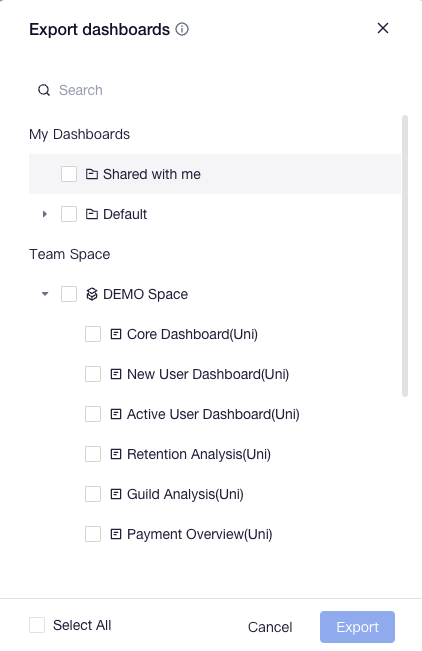
Click the "+" on the upper right corner of the dashboard list, and then click "Export Dashboard" to enter. You may select to export the space, folder and dashboard of any project to generate and download the dashboard configuration file.
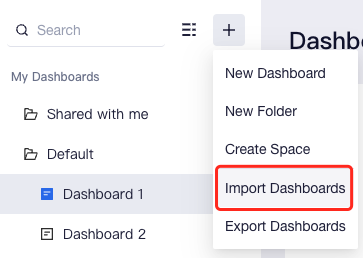
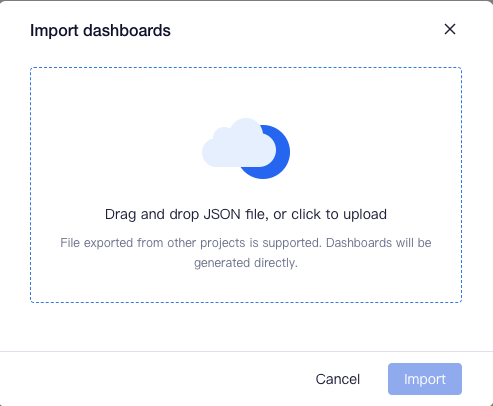
In the project where a dashboard needs to be imported, click the "+" on the upper right corner of the dashboard list and select "Import Dashboard" to upload the configuration file of the dashboard.
You may select any one of the "My Dashboard" or "Project Space" as the location of the imported dashboard. However, if you do not have permission to create a new project space, TE will create a folder named "Space - Original Space Name" under "My Dashboard" and import the original dashboard into it.
The dashboard of the new project can be viewed as soon as it is uploaded and successfully imported.
# Creating a Dashboard by Template
Using Dashboard Template, you can rapidly create a dashboard after specifying the data mapping relationship required by the dashboard. You can view the built-in TE dashboard templates or custom dashboards created by your enterprise in the Template Gallery. When creating a dashboard, you may enter the Template Gallery by clicking Use Templates, or directly using the navigation of Applications.
# Adding Modules to Dashboard
After creating a dashboard, you can add the following modules to it.
# Adding Report
In TE, Reports are tools to view multiple types of data metrics and user tags in a convenient and interactive way.
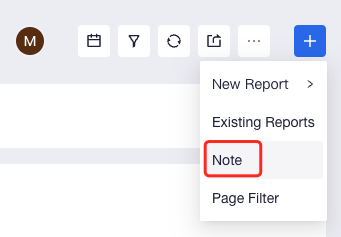
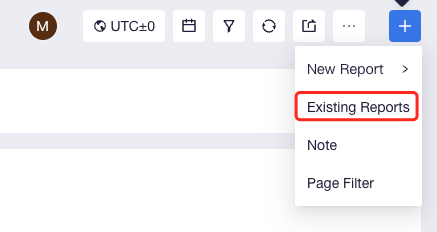
Click "+" on the upper right corner of the dashboard and you will be able to add "New Report" or "Saved Report" to the dashboard.
- In "New Report", you may create a new report based on the model of any "Analytics" module in the TE and rapidly save it to the dashboard.
- In "Existing Reports", you may save previously saved reports on the dashboard. Specifically, in the Users module, you can save any tag of the current project as a report and place it in the dashboard.


# Adding Page Filter
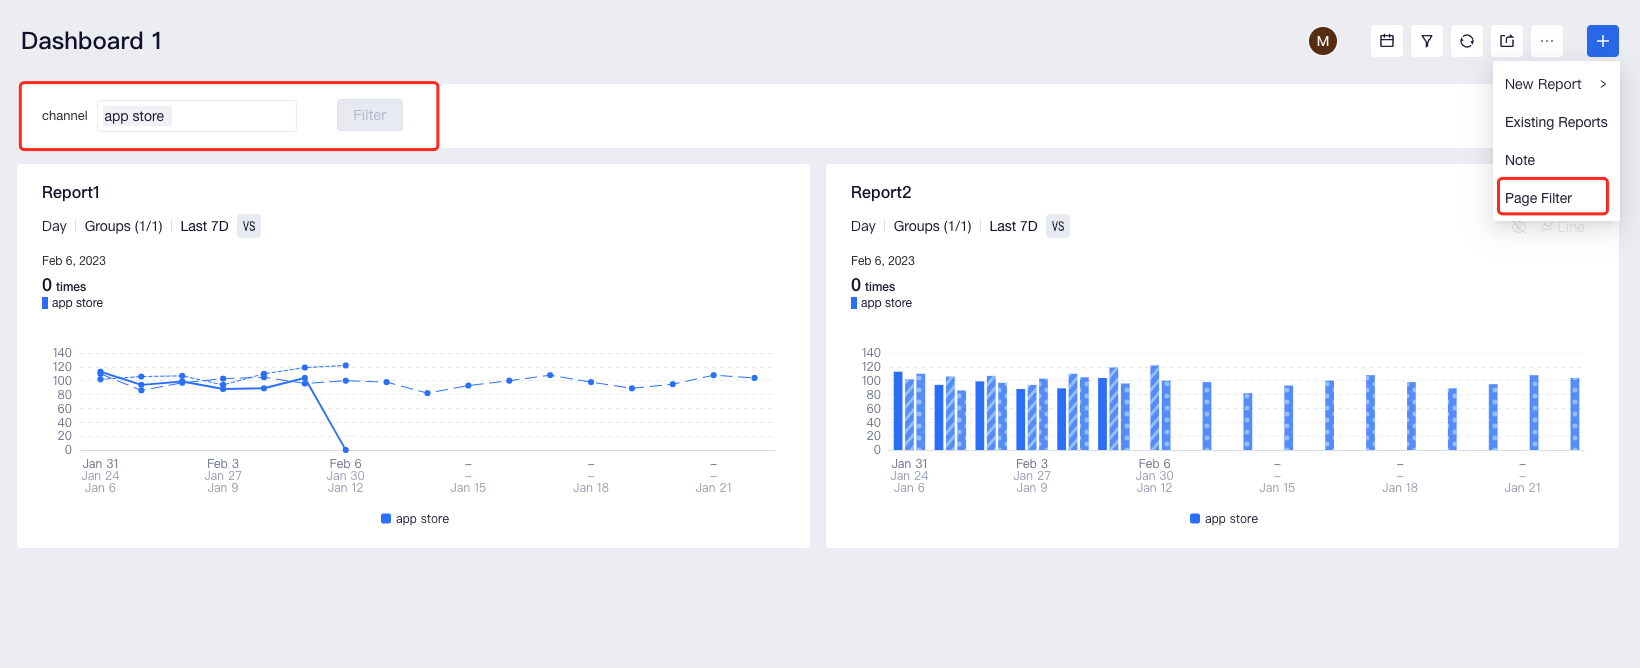
In TE, as the creator or collaborator of a dashboard, if you want to provide dashboard viewers with convenient and multi-dimensional filter analysis capacity, you can add a page filter to the dashboard. For example, after selecting dimensions like "Channel" and adding them to the page filter, dashboard viewers will be able to conveniently view data performances of users from "App Store" or "Google Play".
The creator or collaborators of the dashboard may select "Page Filter" from the "+" on the upper right corner of the dashboard and edit filtering conditions to add a page filter to the dashboard.
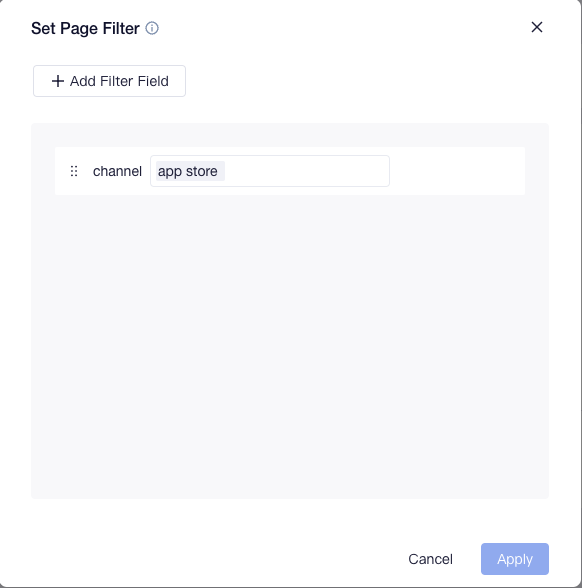
In a page filter, available filtering fields include all user properties, user cohort, user tag and unified event properties used by all reports in the current dashboard. Specifically, the relationship between multiple filtering fields is the "AND" logic. The effects of filtering fields from different properties on reports vary, as shown below:
| Source of Filtering Fields | Scope of Effect |
|---|---|
| Event property, or cohort and tag with event property as their Entity | Event, Retention, Funnel, Distribution and Interval analysis reports, and the Event Table of present project in SQL query. |
| User property, or cohort and tag with user property as their Entity | Event, Retention, Funnel, Distribution and Interval analysis reports, and the User and Event Tables of the present project in SQL query. |
TIP
Currently, only text, numerics, time and boolean fields can be used as filtering fields; when filtering fields involve multiple "AND" logic relationships, each filtering field affects the report across the above-mentioned scope of effect based on its source.
The user tag table, as well as the SQL reports of the cohort table that only utilizes Tag and Cohort Table, History Tag Table, User Snapshot Fact Table and Dimension table, is not subject to the effect of the filtering fields of the page filter.
If dashboard users choose to use custom or complicated filtering conditions in data filtration, please see Conditional Filtering.
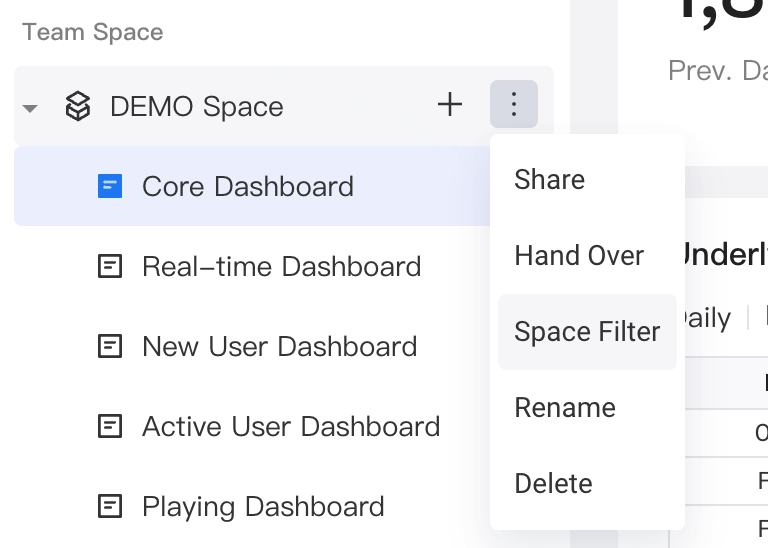
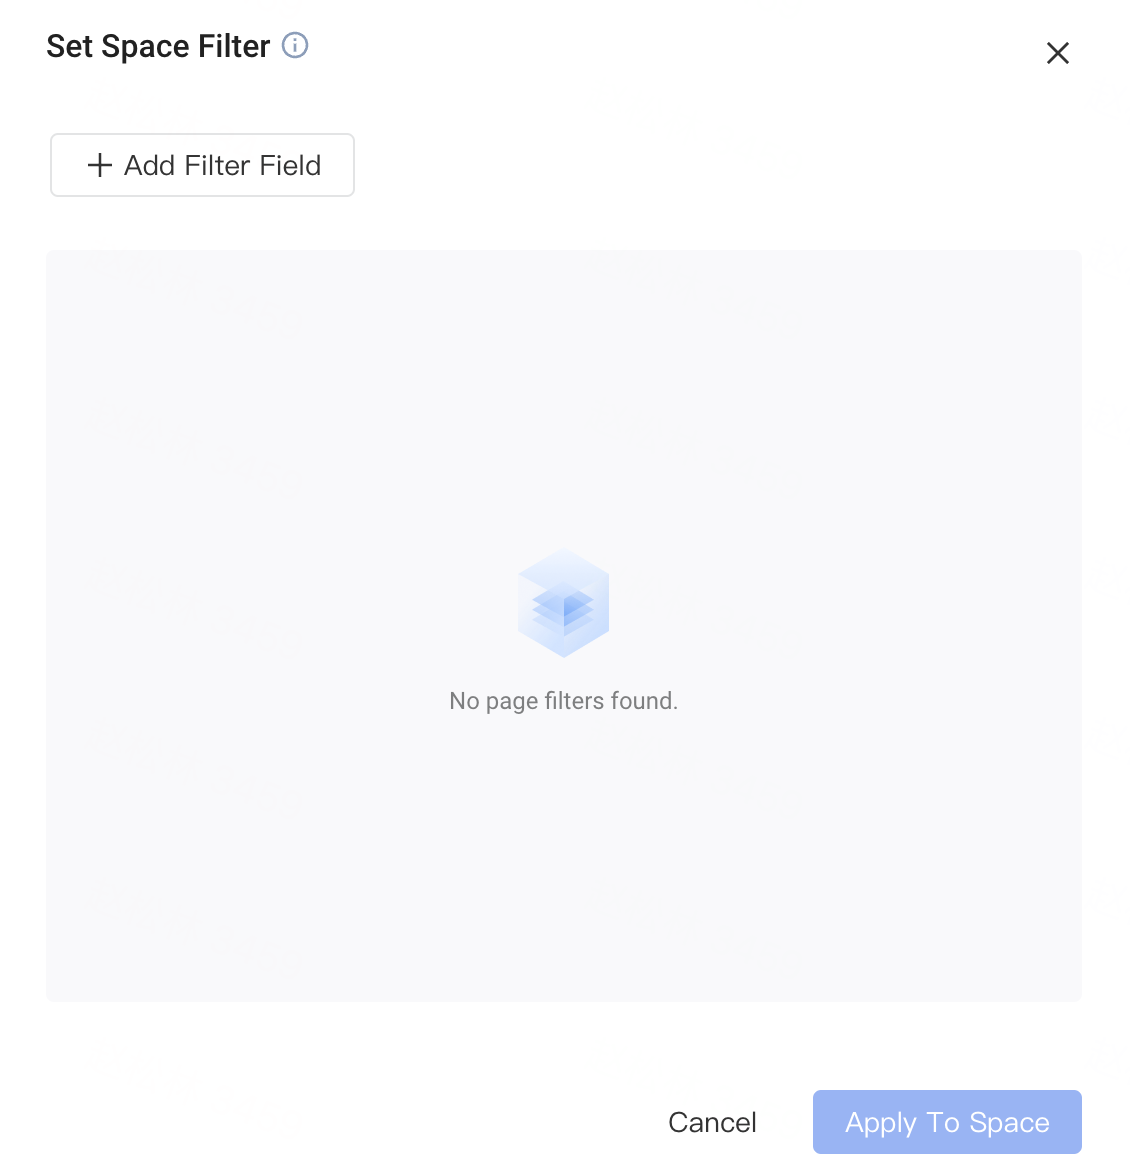
You can set the Space Filter for Team Space. Filter will apply to all dashboards under space.
# Adding Notes
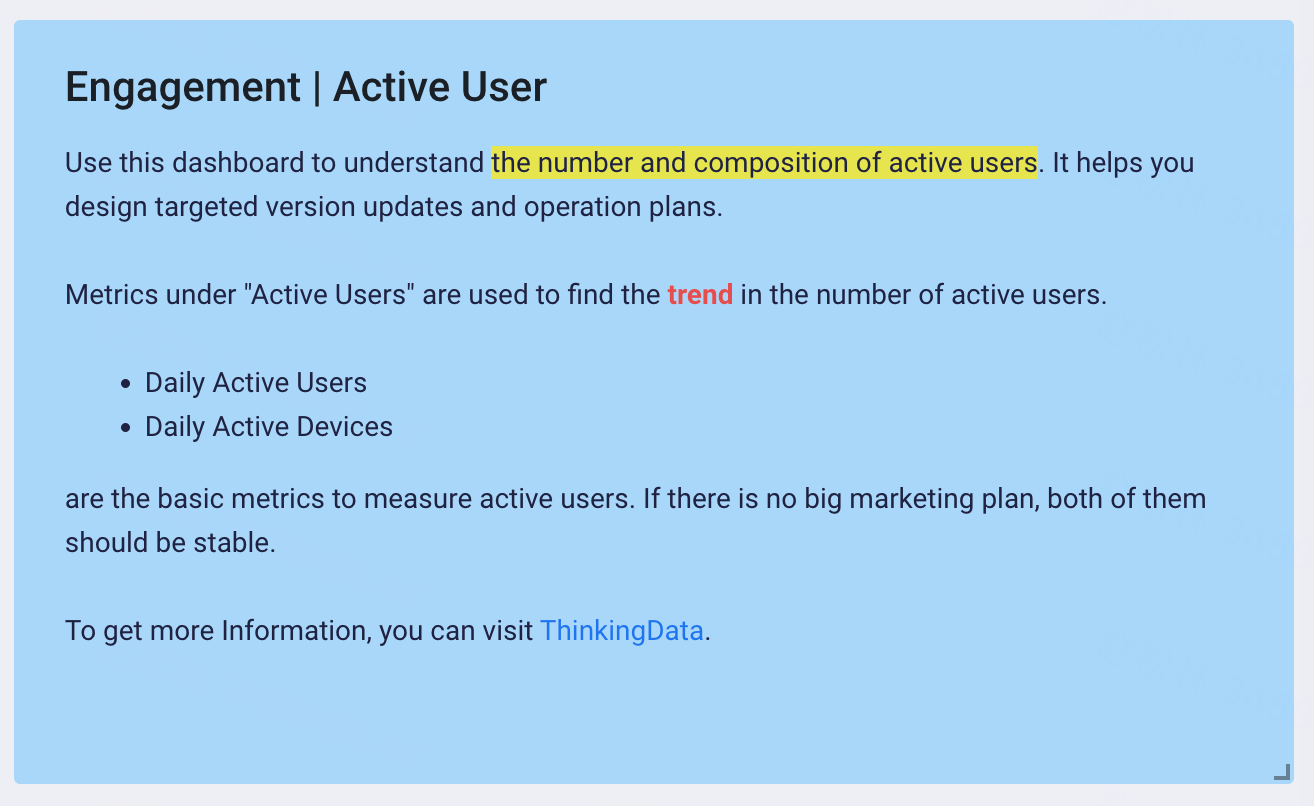
When you need to add business information or descriptions to a dashboard or explain metrics utilized by some reports, you may add a "Note" to facilitate dashboard viewers to understand relevant content.
To create a note, click "+" on the upper right corner of the dashboard, select "Note".
You can use different font sizes to highlight key content, modify font and background colors, and insert links to provide better context for your analysis.
# Adjusting Dashboard Configuration
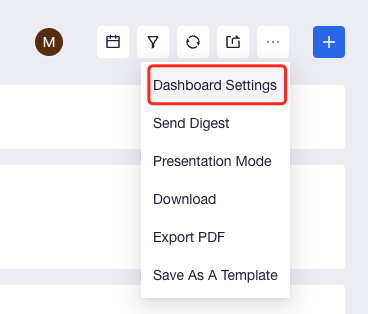
# Adjusting Dashboard Settings
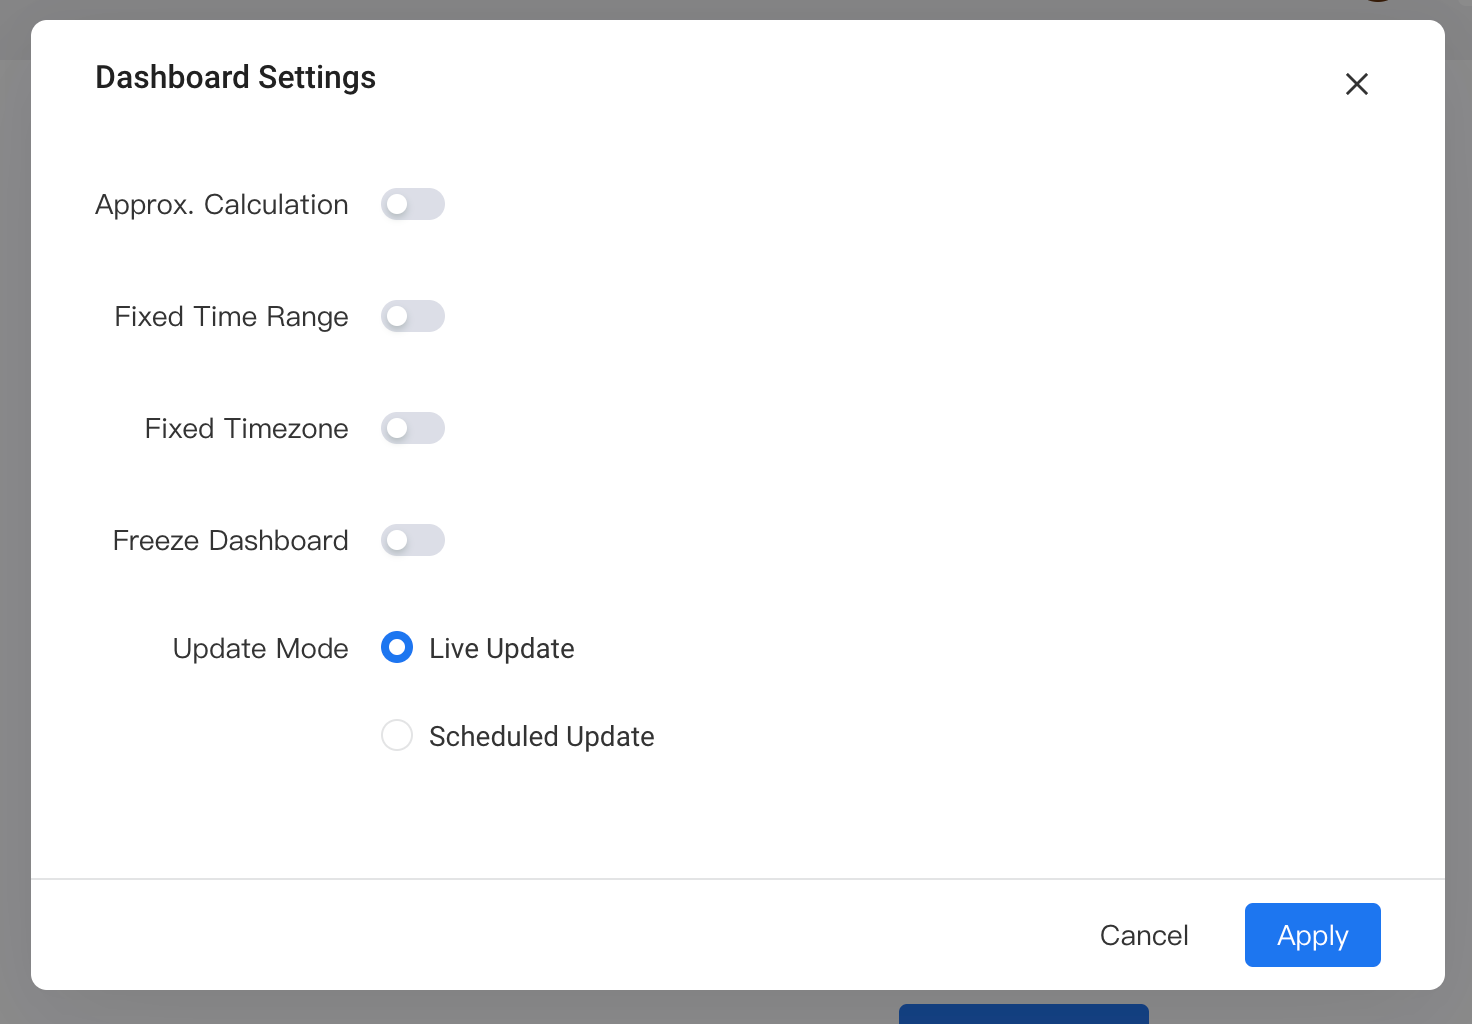
# Approx. Calculation
By default, accurate computation is performed by a dashboard, that is, each computation will produce accurate results based on conditions.
If you want to improve query efficiency, you may enable the "Approxi. Calculation" option. Enabling approximation can significantly reduce performance overhead and computation time, and the error of the results between approximation and accurate computation can be controlled within 4‰. Approx. Calculation adopts theHyperloglog algorithm.
# Fixed Time Range
If you want to unify the starting and ending date of all reports in a dashboard, you can open "Fixed Time Range". This setting is suitable for the case where you need to view the overall data of a regular campaign.
# Fixed Timezone
If you want project members to view data of a certain dashboard within the same time zone, you may enable Timezone Fixation. When the feature is disabled, project members can decide the time zone at which the dashboard is viewed based on their default timezone.
The setting is only available when the "Multi-Timezone Switch" is enabled by the project.
# Update Mode
By default, a dashboard is in "Live Update" mode, that is, a dashboard is updated every time it is accessed.
For dashboards involving a large amount of computation but less rigorous requirements on the real-timeliness of data, you can enable "Scheduled Update" to improve presentation efficiency. When Scheduled Update is enabled, TE will compute and refresh new results of the dashboard on a daily basis and store the results in cache to make it more convenient for viewing.
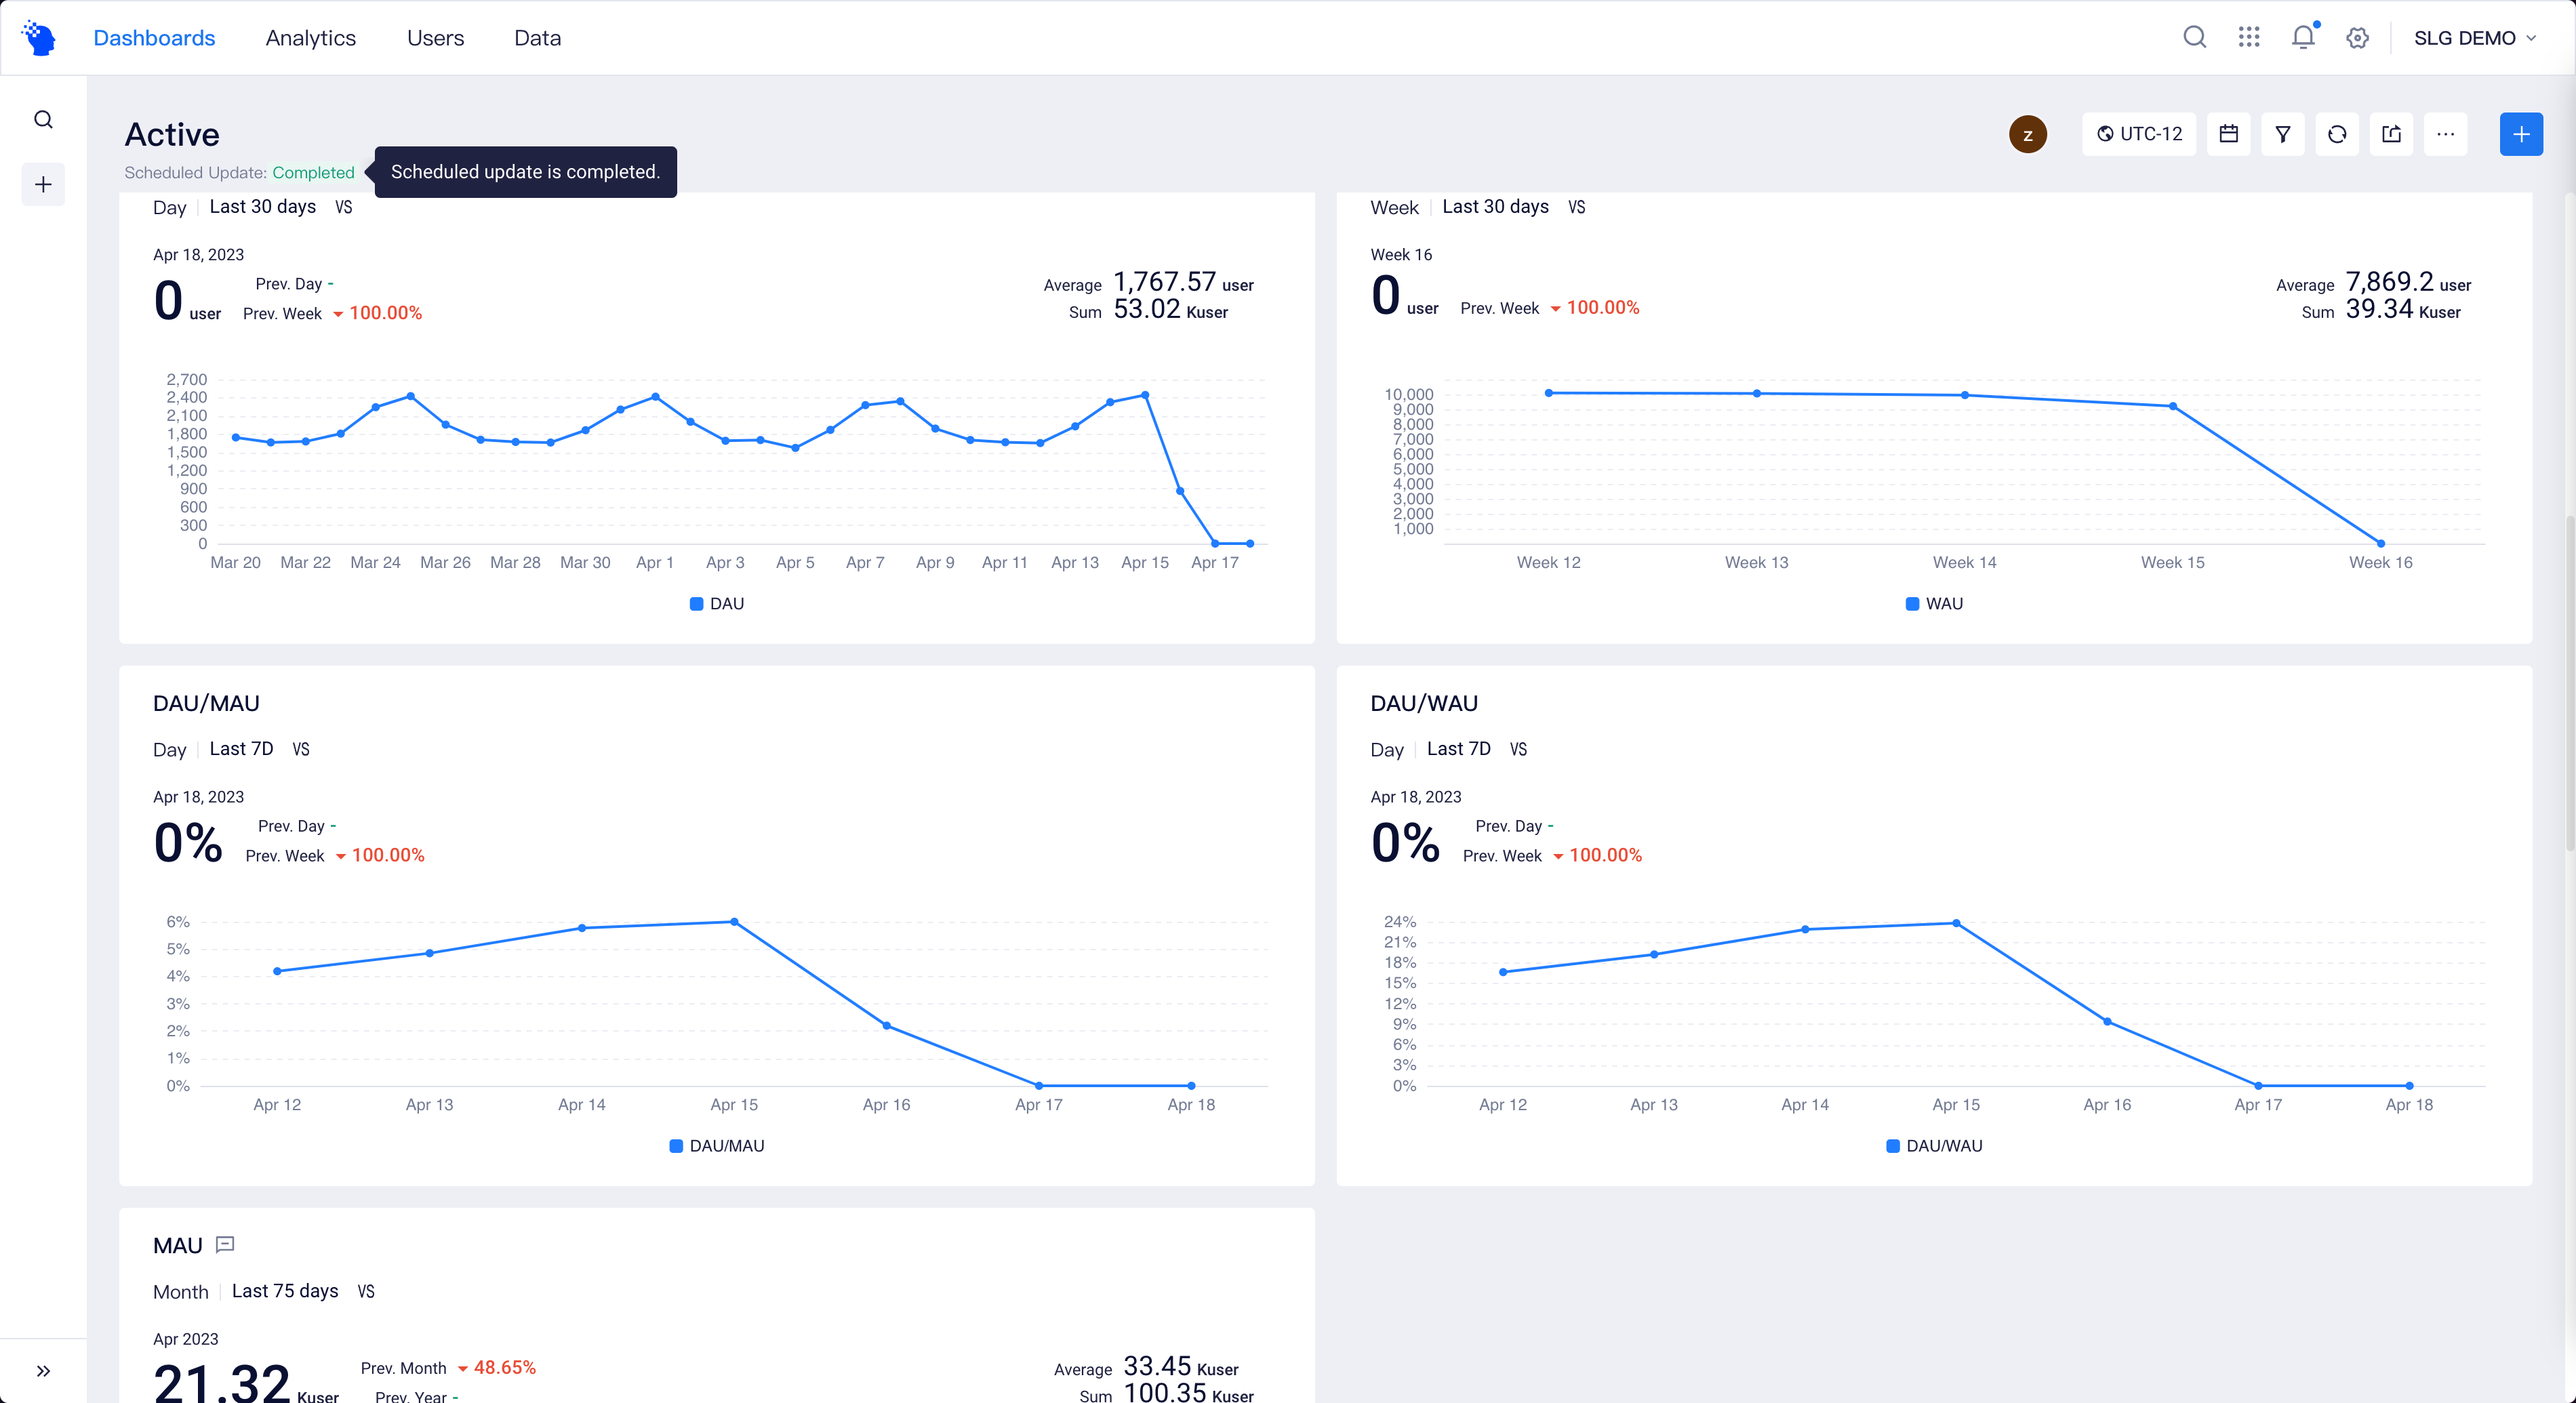
If the current dashboard is in "Scheduled Update" mode has enabled scheduled updates, and the selected time zone is consistent with the timezone of the "Scheduled Update" mode, status will be displayed below the dashboard name.
# Adjusting Dashboard Filter
# Date Filter
Using Date Filter, you may unify the time range of different reports in a dashboard except user tag and SQL reports.

# Global Filter
When you want to perform data filtration or filter data with multiple complicated conditions, you can use Global Filter.
The filtering fields and the mode and scope of action of filtering fields on reports available to conditional filtering are similar to those of Page Filter. However, the logical relationships between multiple filtering fields can be "AND" or "OR".
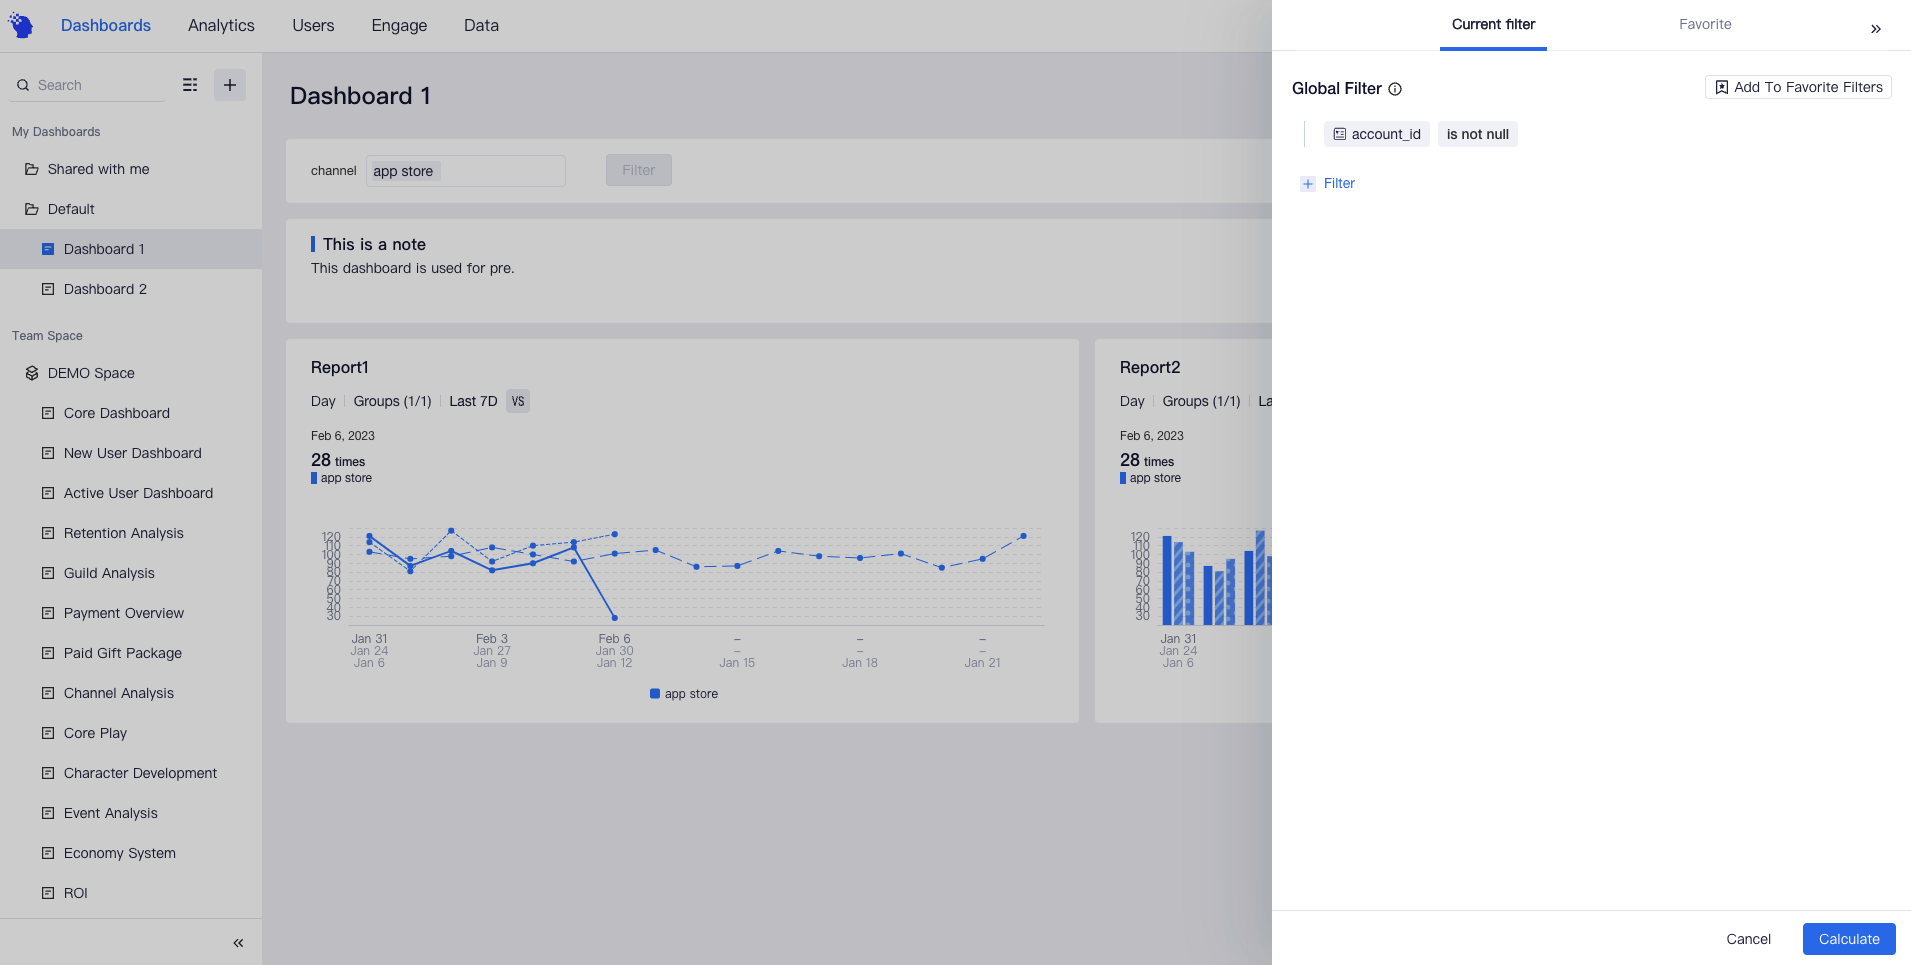
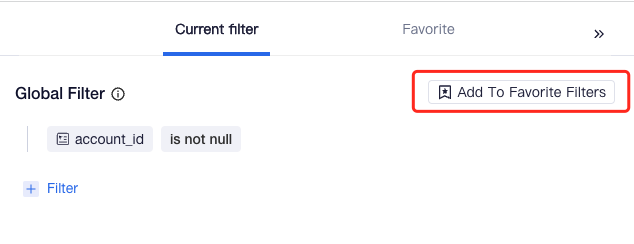
Using "Add to Favorite Filters", filtering conditions can be set as a global default filter by the creator and collaborators of the dashboard to make the conditions take effect on all members of the dashboard; or, they can also be set as a default filter to take effect on the setter.
# Adjusting Dashboard Content
# Adjusting Layout
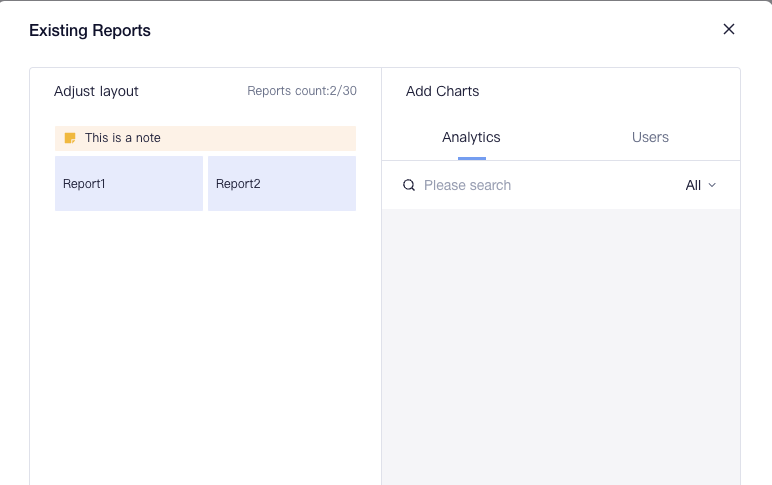
When locations of different modules in the dashboard need to be adjusted to sort out the dashboard structure, you can use the "Adjust Layout" feature.
The feature is accessible from the "Existing Reports" in the "+" on the upper right corner of the dashboard.
# Create Dashboard Permissions
Category of Permission | Permission Details | Company Root | Project Owner | Analysis Manager | Analyst | Regular Member |
|---|---|---|---|---|---|---|
Dashboard viewing | View dashboards and dashboard settings, enter presentation mode. | ● | ● | ● | ● | ● |
| Use global filters and page filters to view dashboards. | ● | ● | ● | ▲ | ▲ | |
| View all dashboards and reports in the project. | ● | ● | △ | ○ | ○ | |
| Dashboard editing | Create dashboards, folders, and change dashboard settings. | ● | ● | ● | ▲ | △ |
| Import and export dashboard settings, copy dashboards. | ● | ● | ● | ▲ | △ |
● Compulsory availability for roles
▲ Availability by default for roles, but unavailability is allowed
△ Unavailability for roles by default, but availability is allowed
○ Compulsory unavailability for roles