# Basic Concepts
The Analysis Module allows you to quickly create specific metrics based on aggregation of events and properties, and present the result data in charts and tables to observe trends in metrics and perform multi-dimensional cross-comparisons. This article will introduce the core concepts in the TE Analysis Module.
You can learn more about events and properties in Data Management.
# Analysis metrics
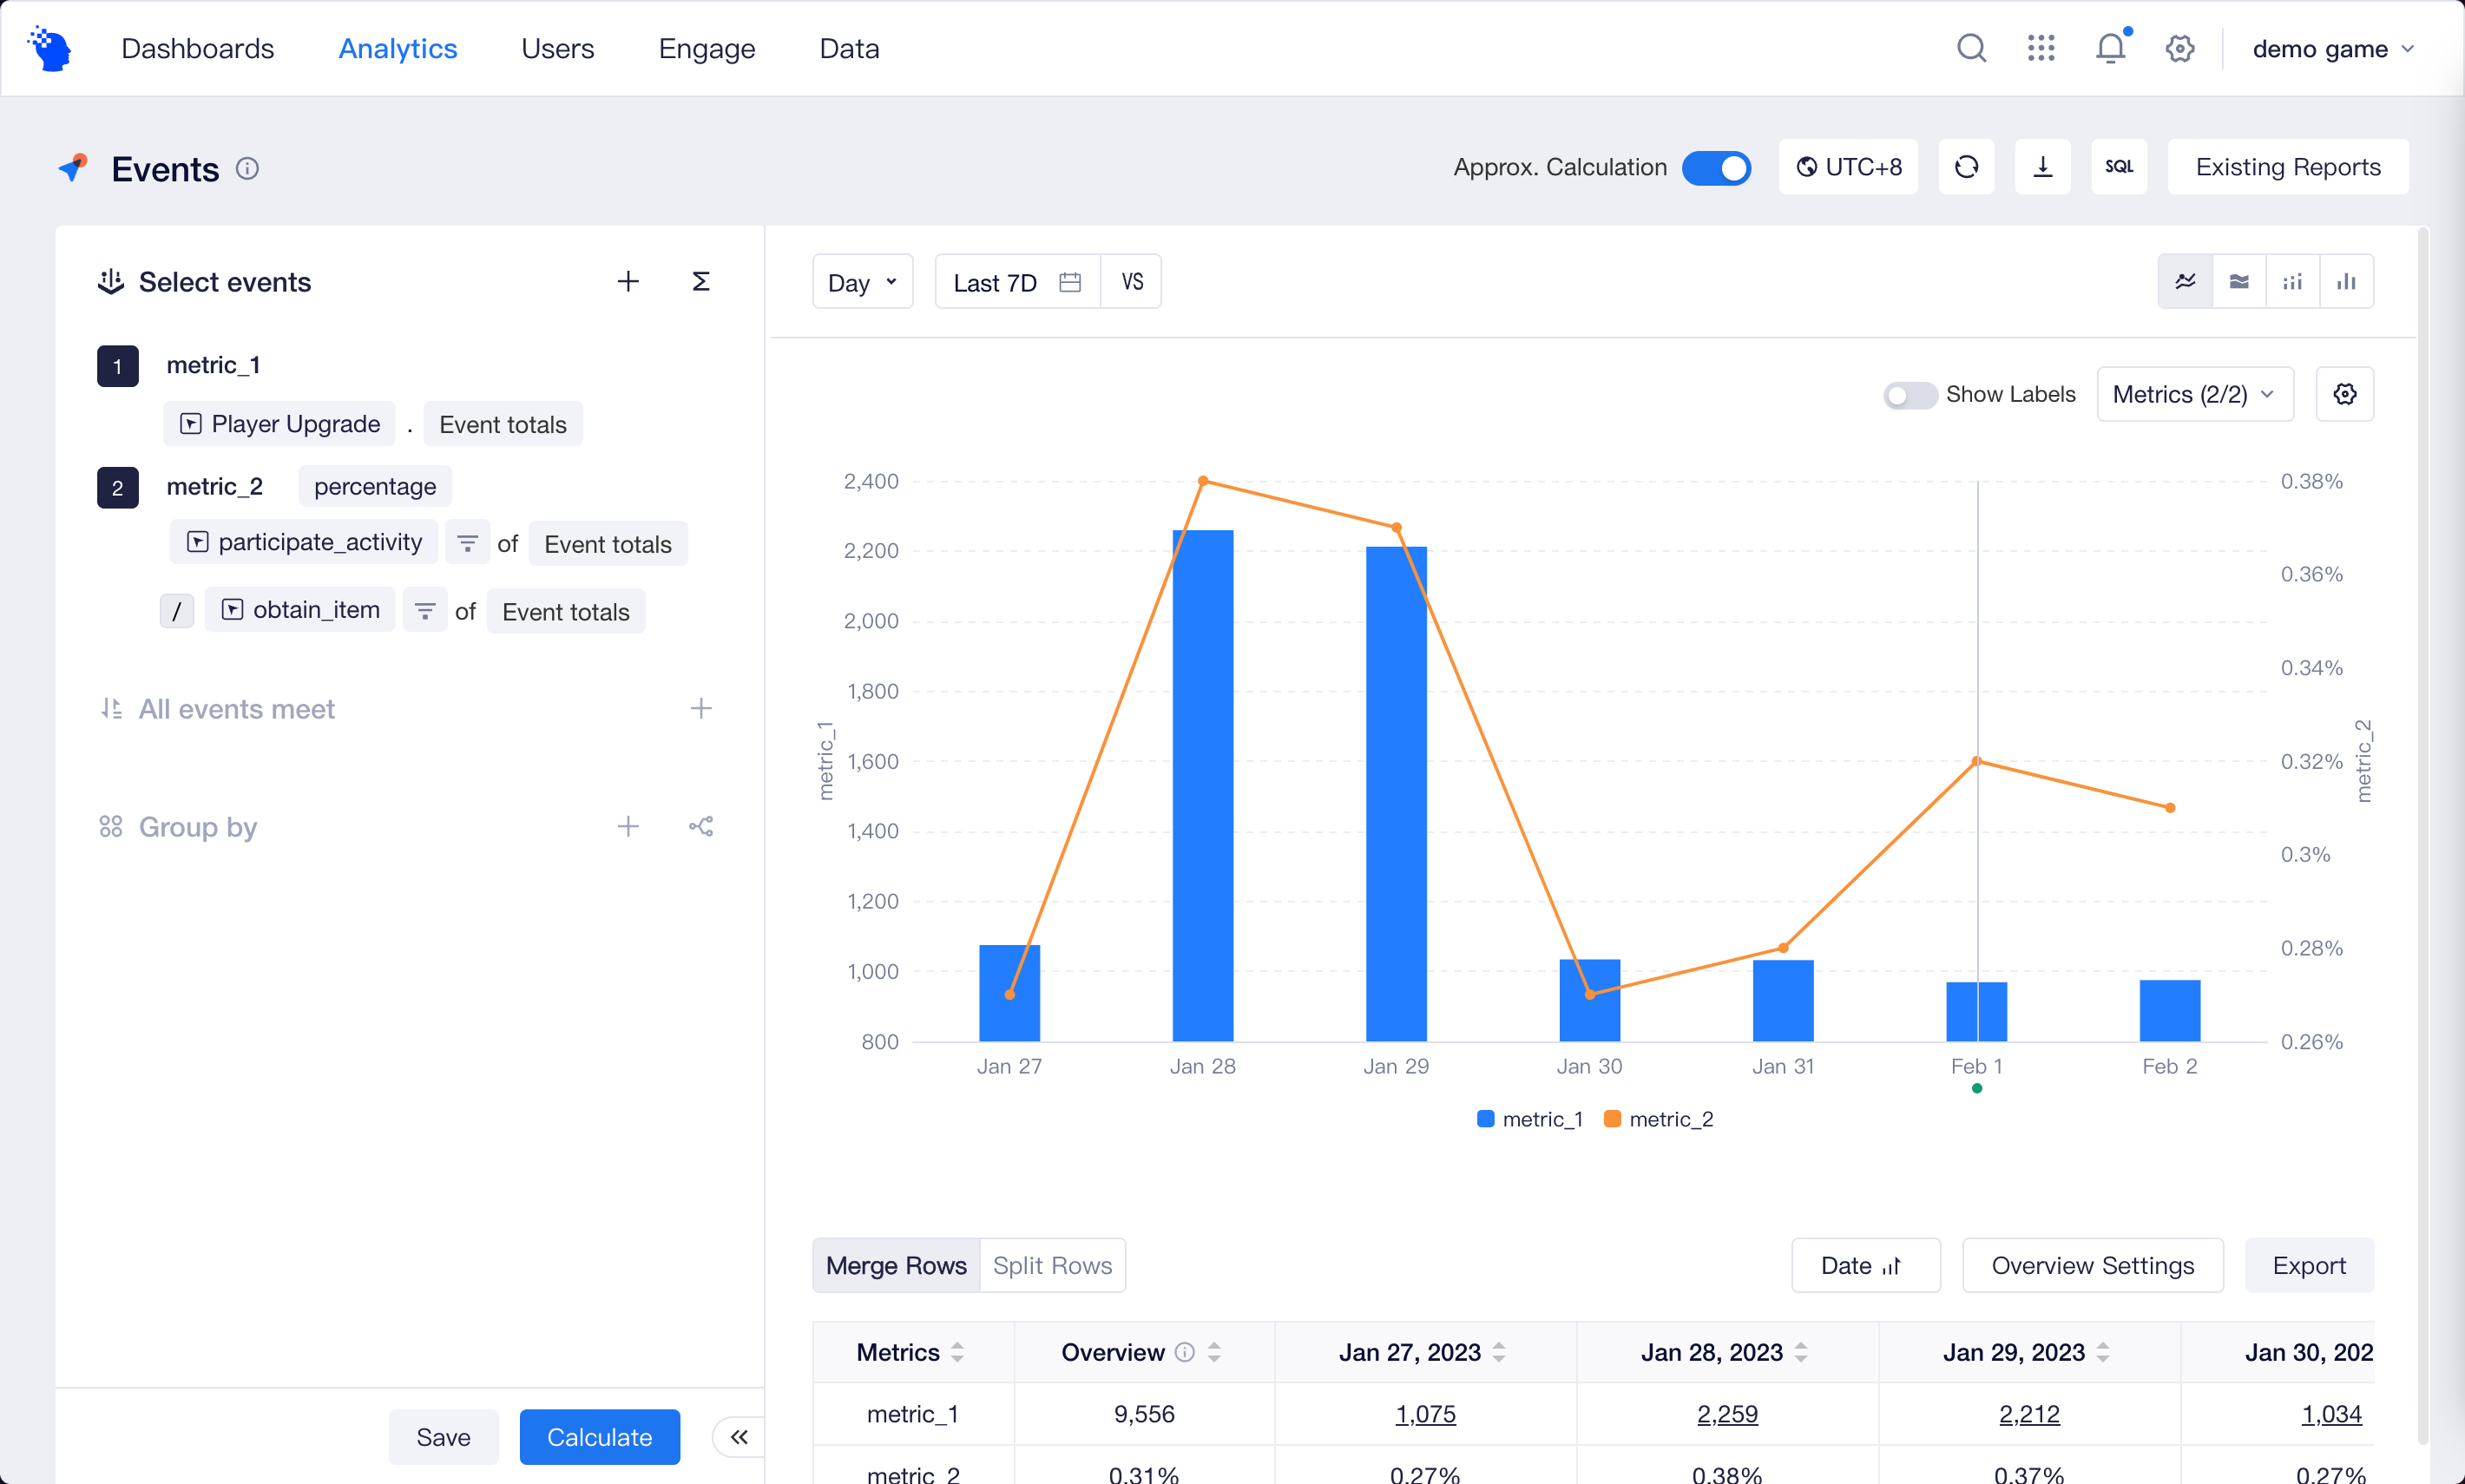
You can quickly construct analysis metrics in the metric settings on the left side of the model page, and get the result data in seconds without complicated SQL statements.
In the Events model, analysis metrics can be defined in a very flexible manner. You can choose the free combination of events and properties according to your requirements, and also get formula-type analysis metrics based on the four arithmetic operations.
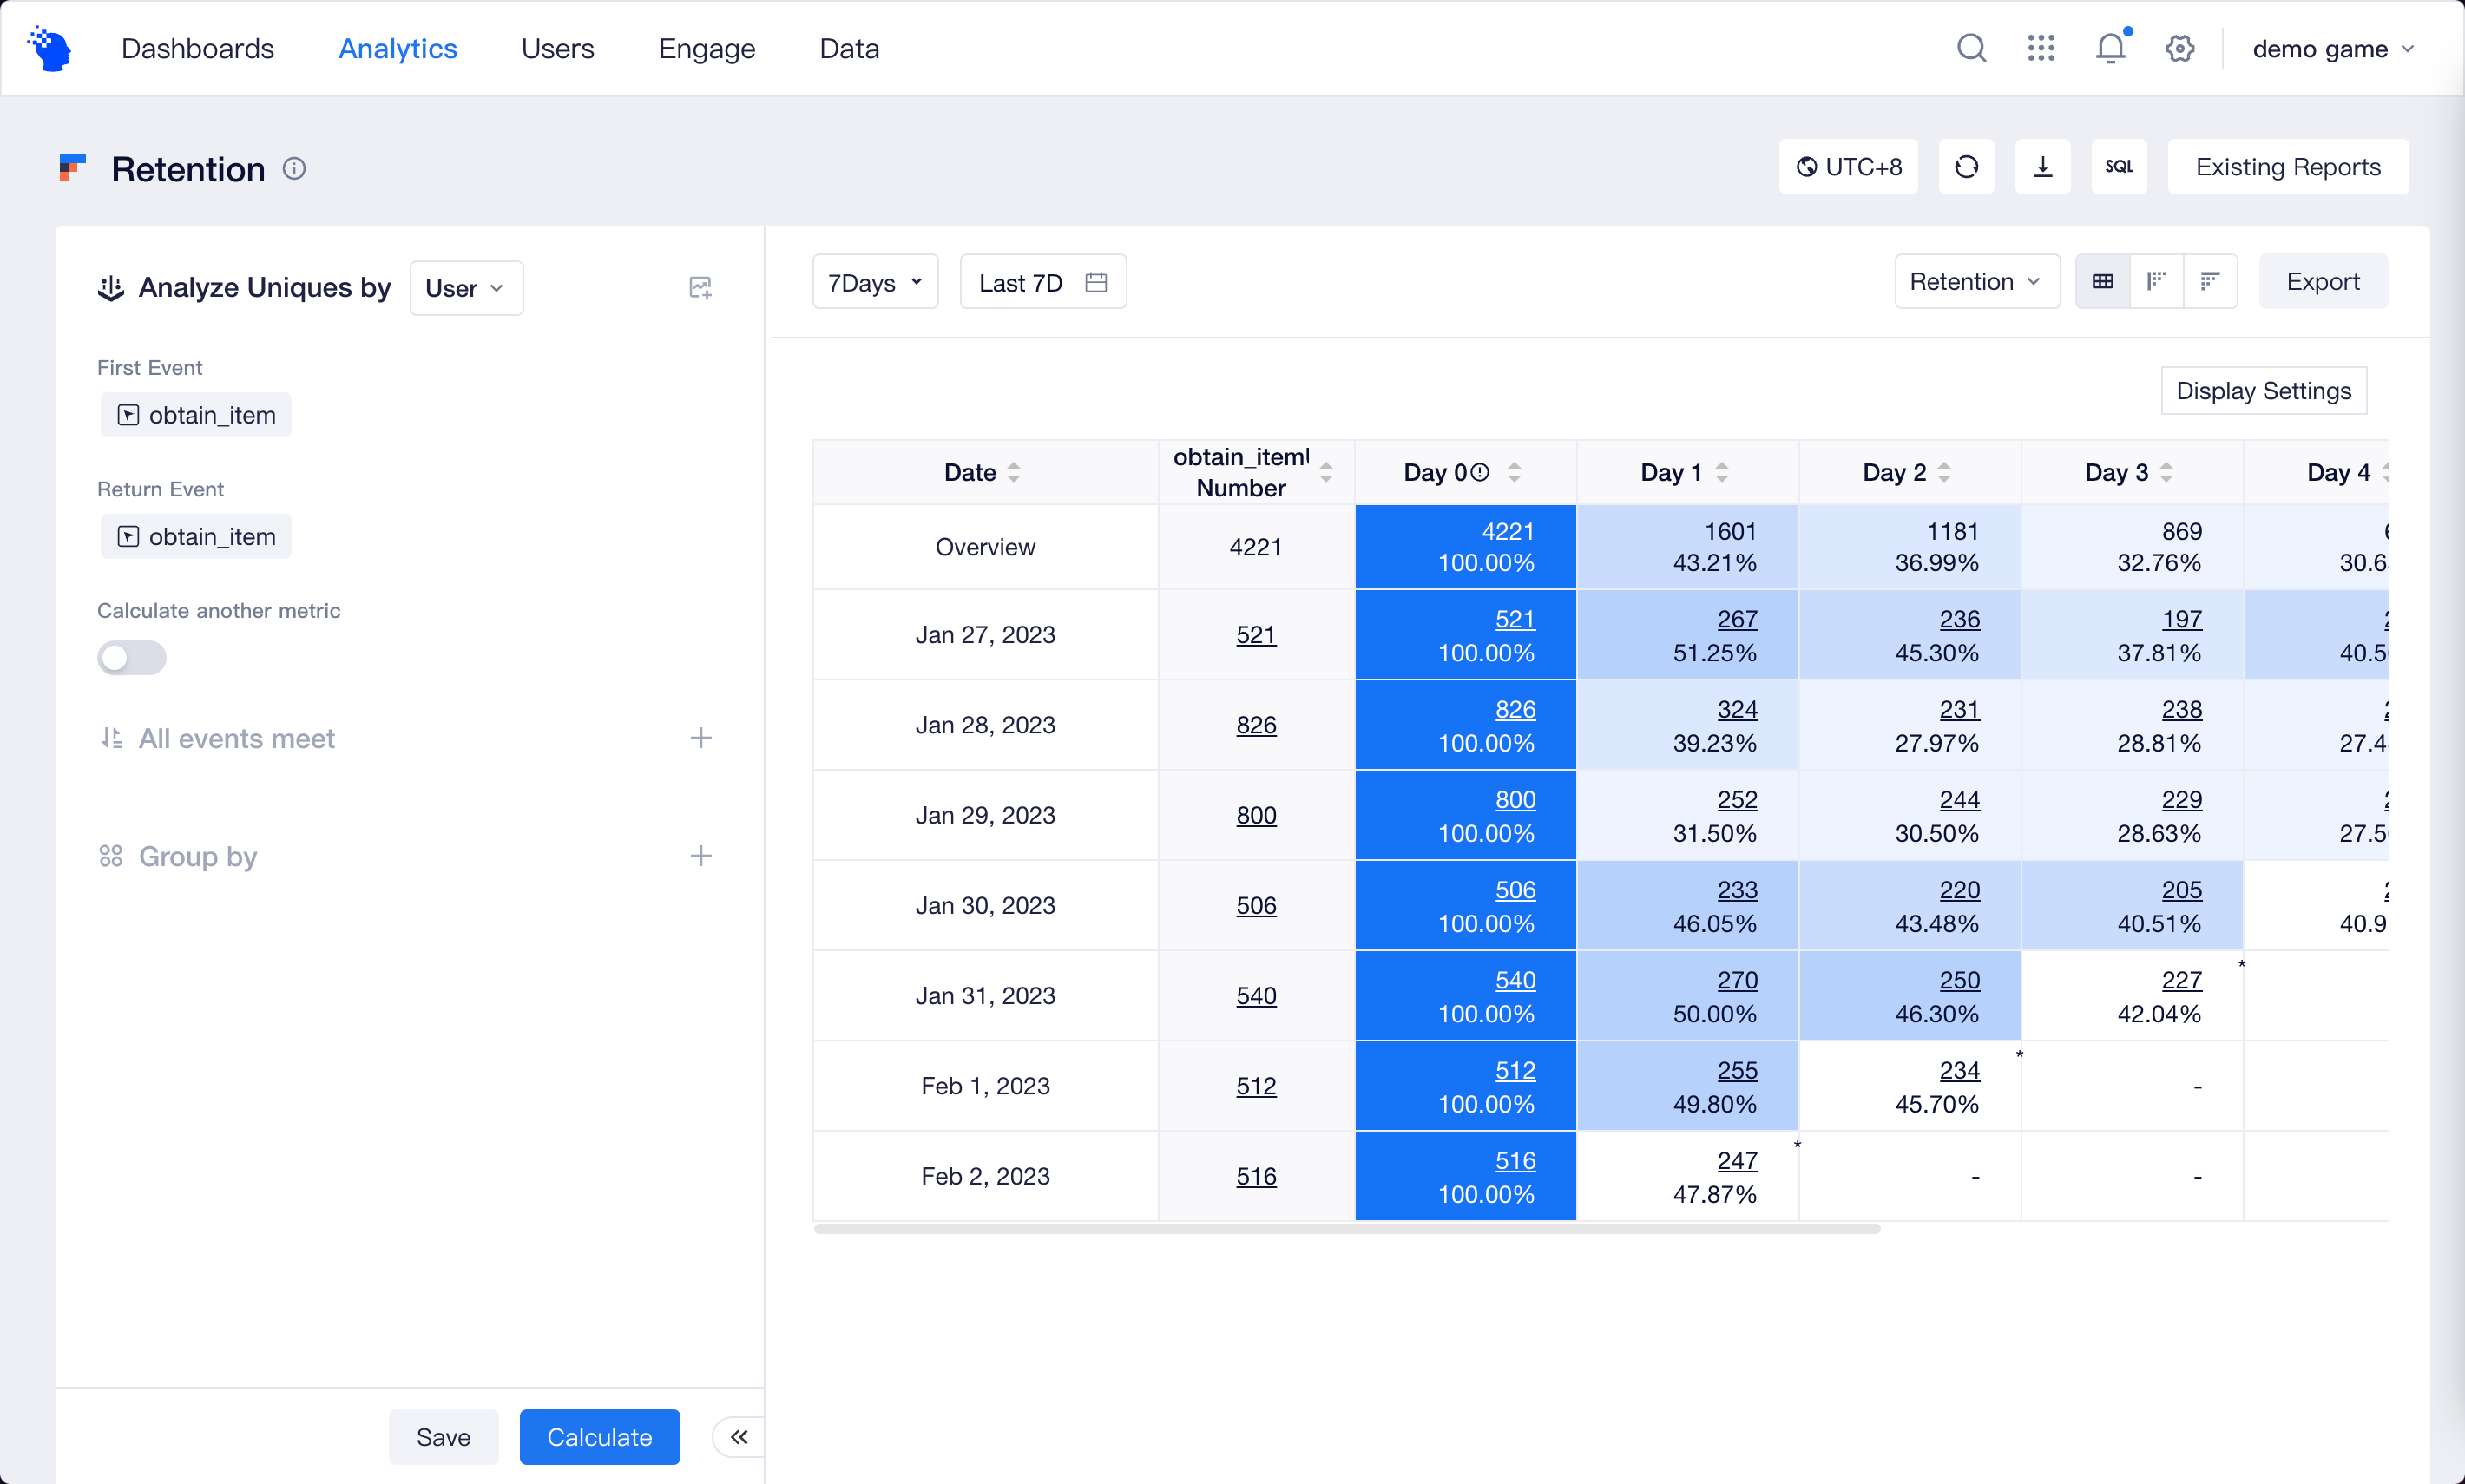
For models such as Retention, the calculation logic of the analysis metrics is already defined, such as retention rate, churn rate, converted number, etc. You only need to select the corresponding events and set the time frame for calculation to get the results.
Of course, you can also directly build a project metric system and use Product Metrics in the analysis to ensure uniform specifications. For more information about it, please see Product Metrics.
# Analysis Period
The analysis period defines the time frame for events to be included in the statistical analysis of metrics. Different data results can be obtained for the same metric in different analysis periods. The analysis period must be set for all models except Composition and SQL IDE.
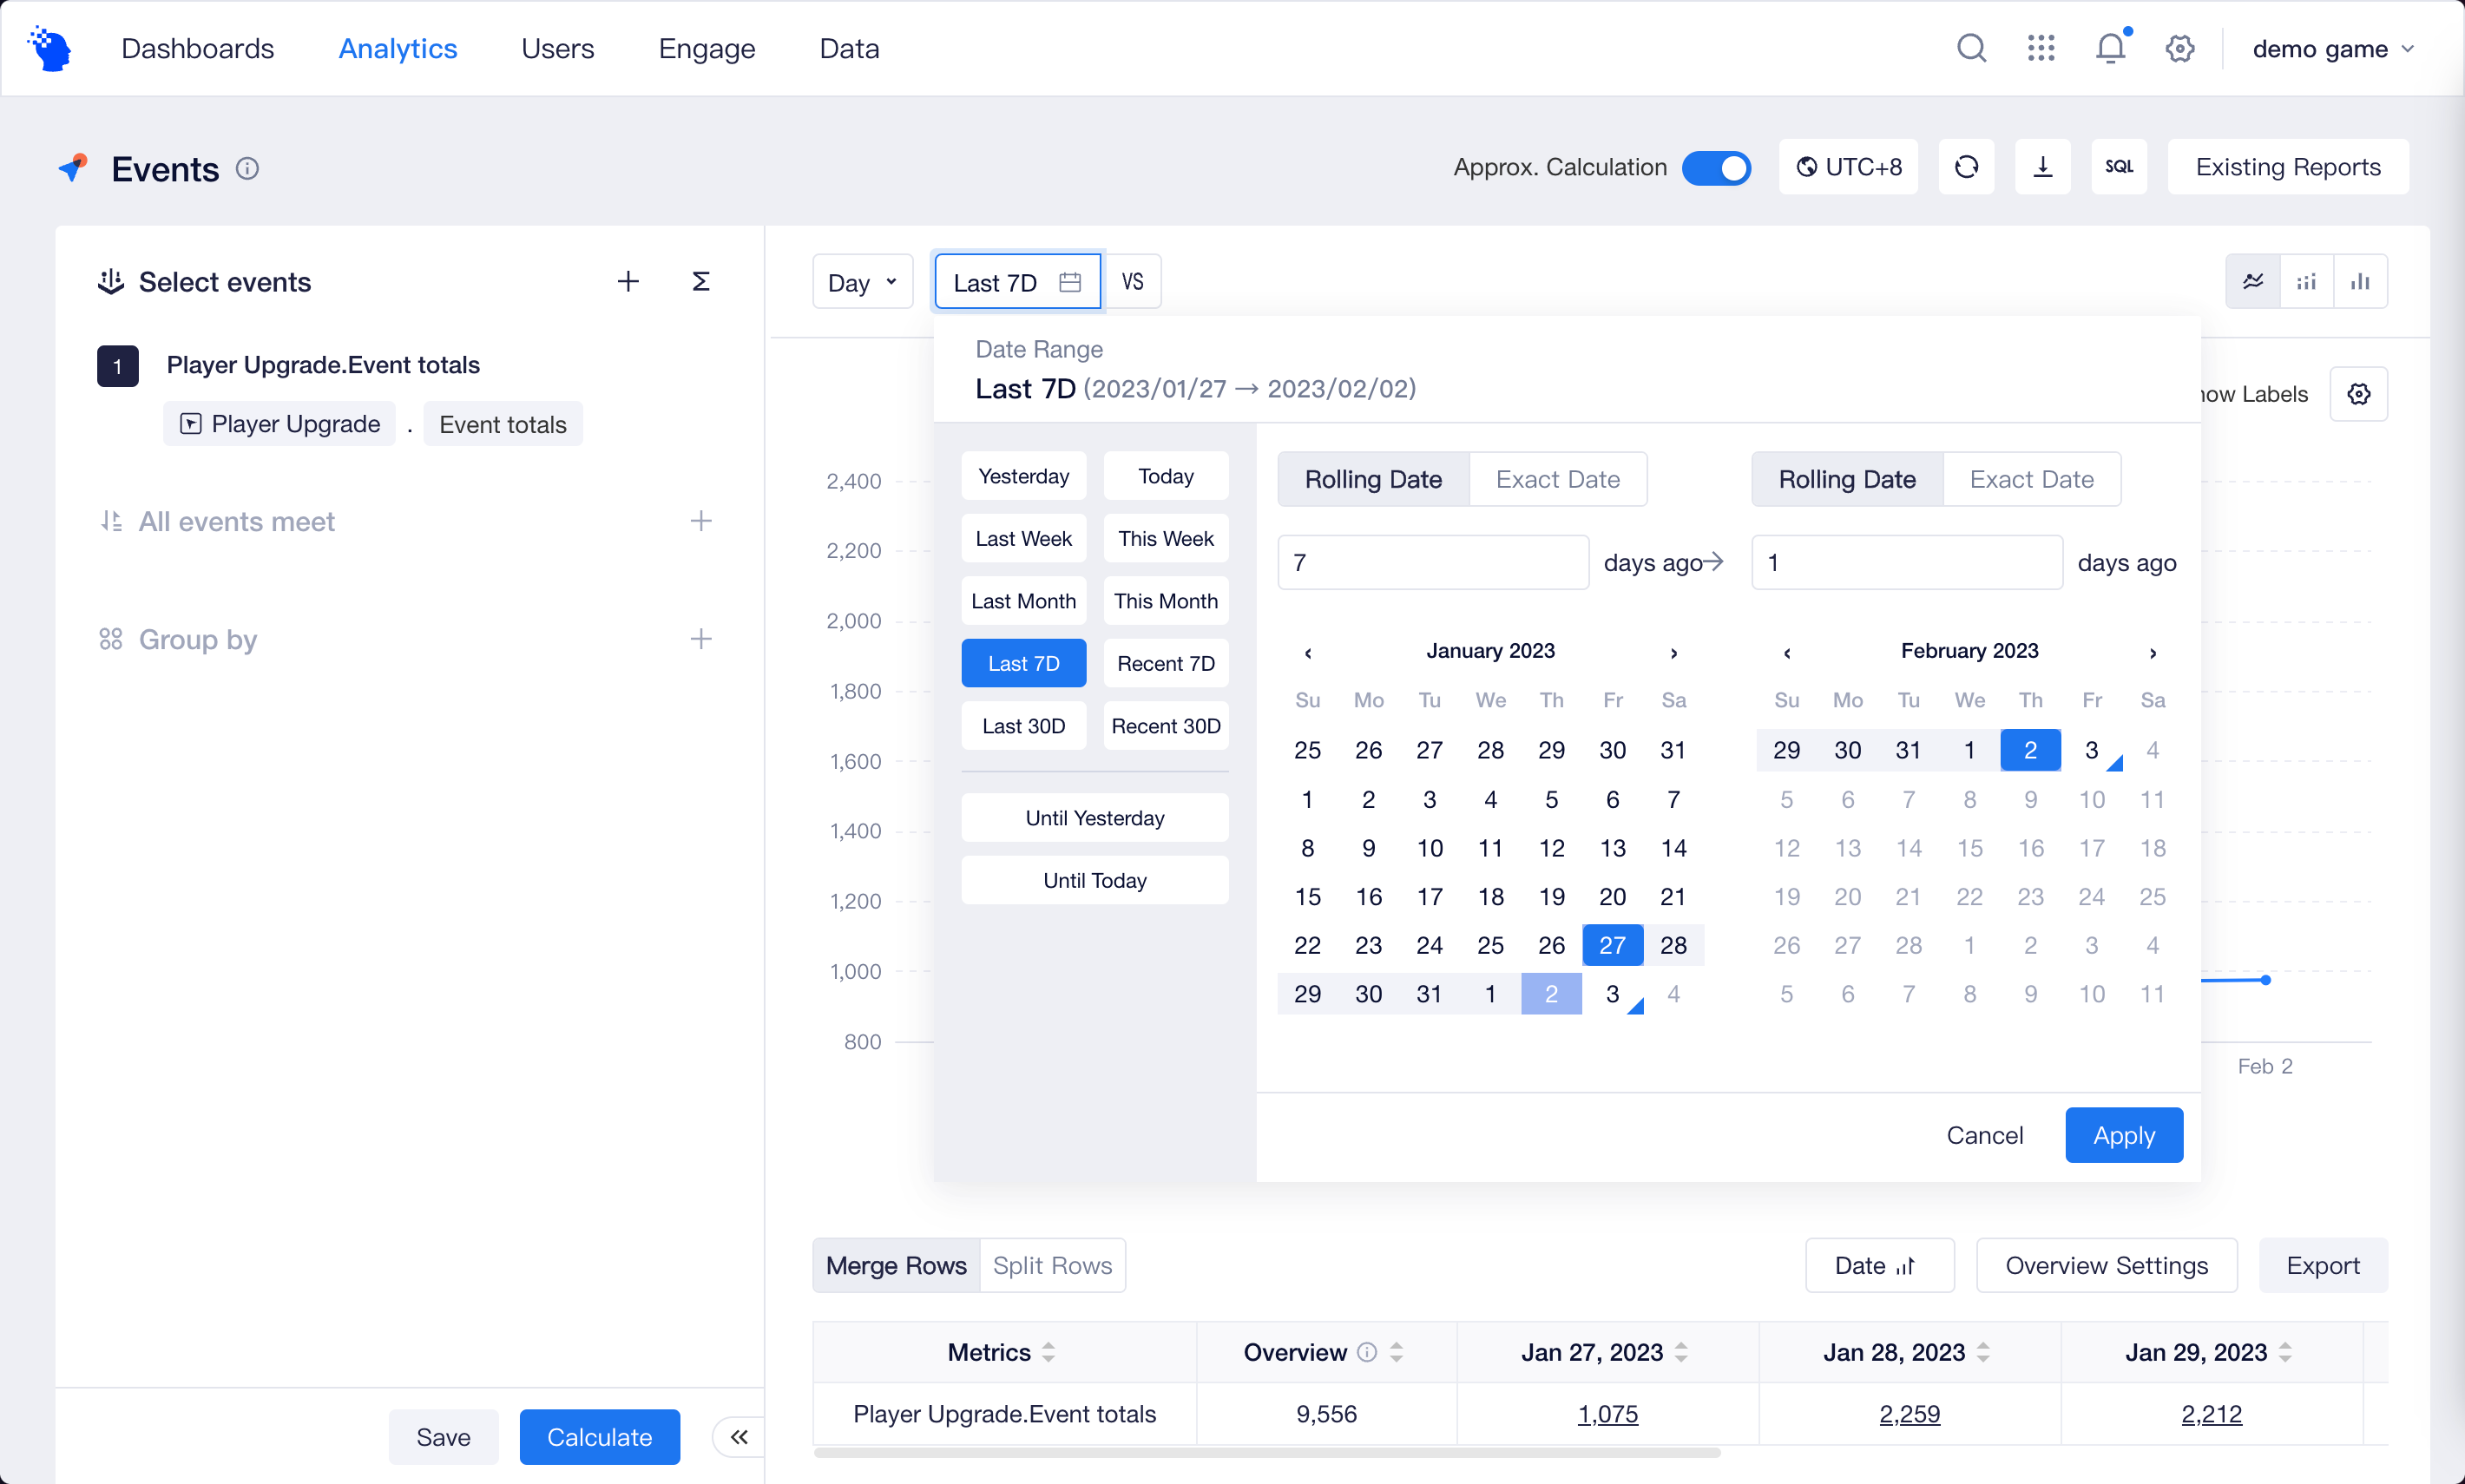
You can select Rolling Date relative to 'today', such as the last 7 days, by using the options on the left panel, or you can customize the analysis period by selecting a start date and an end date respectively.
In addition to Rolling Date, you can also select Exact Date, i.e., a specific time/date that will not change with "today". When using Exact Date, the time/date can be set later than "today". When the end time/date is Exact Date, the start time/date can only be Exact Date.
# Time Zone
When a product has users in different time zones, you need to understand the logic of processing time zones in your analysis. If you need to collect user data from multiple time zones, you need to record and report the user’s time zone when the event happened using the time zone field, and enable the Multiple Time Zones in the Project Timezone.
In reports, you should first specify which time zone you would like to conduct analysis in. The system will convert the event time (#event_time) from different time zones to calculate and display in the selected time zone, avoiding data mismatch caused by time zone difference.
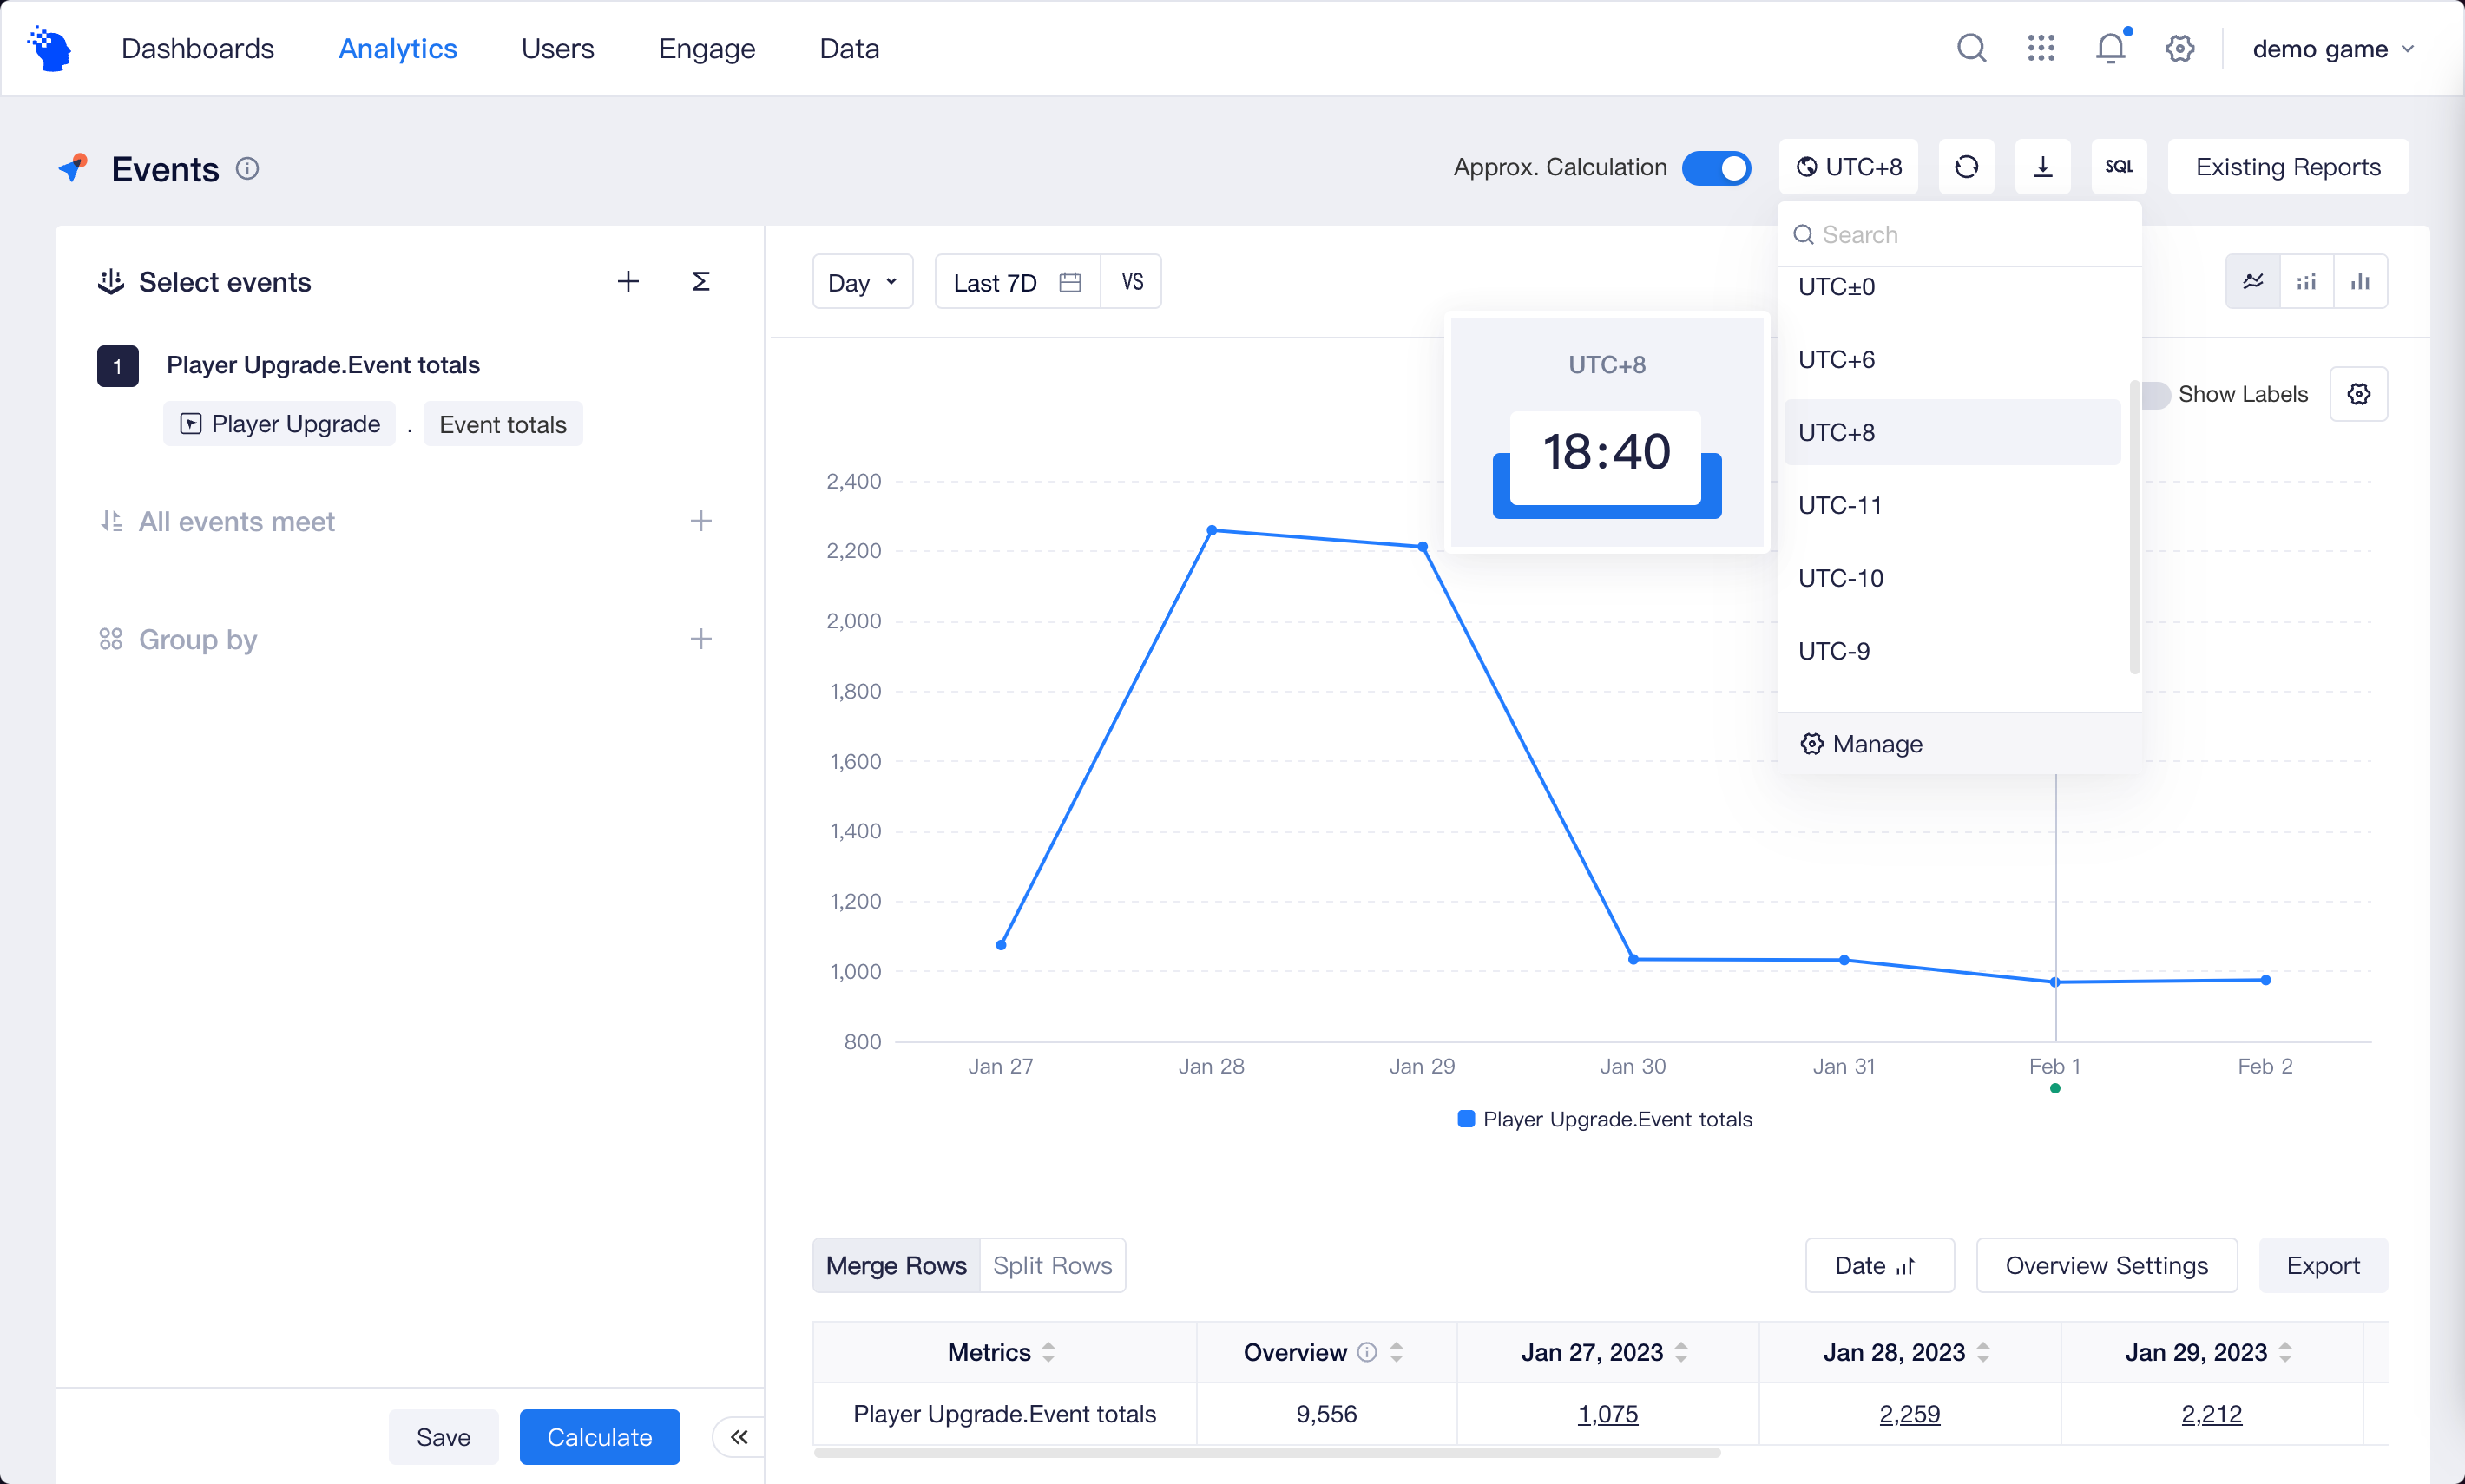
The TE system uses Coordinated Universal Time (UTC) as the standard for recording and displaying time zones. For example, a user in UTC-8 time zone registers at 20:00:00 on Dec. 31, 2022 (local time) and another user in UTC+8 registers at 12:00:00 on Jan. 1, 2023 (local time), two users actually register at the same moment. If the time zone for display is based on UTC+8, the two users will be recorded as new users on January 1; when the time zone for display is UTC-8, they will be counted as new users on December 31.
Notes
- In addition to the event time (#event_time), other time-related event properties will also be converted to the display time zone, including custom property and dimension table property.
- When defining custom properties, please note that time-related event properties are used in local time.
- Time-related user properties will not be converted to the selected time zone.
# Entity
Whether you are analyzing the retention rate, conversion rate or the distribution of different zones, it is necessary to determine the definition of "user" first. "User" is also called the "Entity" within TE.
By default, the analysis model uses the TE Account ID (#user_id) for analysis, but you can also create Custom Entity in the Entities and use them in the model, tags and cohorts.
Assume that a #user_id corresponds to a character in your game, and multiple characters can be created with the same account. When analyzing the number of days of login of the "account" in the Distribution Analysis model, as long as the user log in as any character in a day, the account is considered to have had login events that day. In Retention, you can also both get more accurate data results by analyzing from the perspectives of both character and account.

Like TE Account ID, you can also go deeper to the User Behavior Sequence page for each Custom Entity to see its detailed behaviors.