# Debugging and Logging
During the process of SDK Integration, you can perform real-time debugging by checking SDK logs in the IDE console or using the Debug function of TE.
# Logging
TDAnalytics.enableLog(true);
After enabling the log, you can observe the data tracking of SDK in IDE.
# Debugging
You need to follow the following two steps to enable the Debug mode:
# 2.1 Use DebugConsumer
The sample code for enabling the Debug mode on the client side is as follows:
/*
DebugConsumer: Data is reported item by item. When a problem occurs, the user will be prompted with logs and exceptions; it is not recommended to use it in an online environment
The third parameter identifies whether to enter the warehouse, true indicates the warehouse, and false indicates not to enter the warehouse
 */
TDAnalytics te = new TDAnalytics(new TDDebugConsumer("serverUrl","appId","deviceId"));

Map<String,Object> properties = new HashMap<String,Object>();
properties.put("name", "shoes");
try {
     te.track("account_id","distinct_id","payment",properties);
} catch (Exception e) {
     System.out.println("except:"+e);
}
# 2.2 Add Device
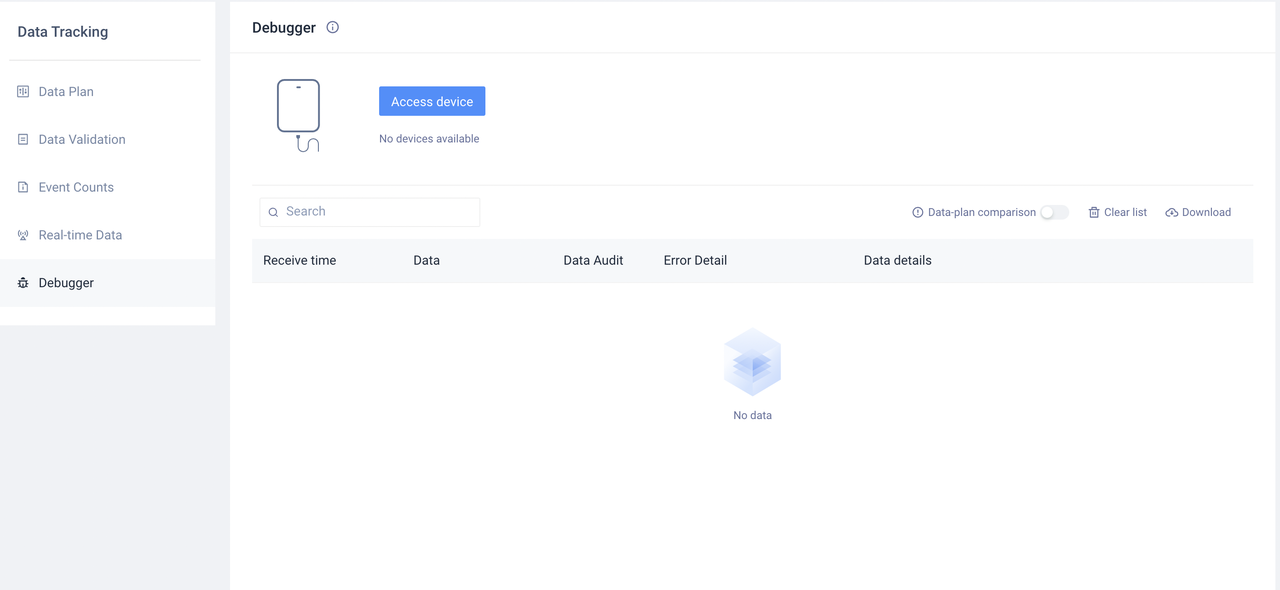
To avoid launching the Debug mode in the production environment, it is required that only specified device can enable Debug mode. The Debug mode can only be enabled for devices whose ID has been configured in the "Debug data" sector on the "tracking management" page of the TE.

It can only be used for data verification at the integration stage, and should not be used in the online environment.
