# 디버깅
SDK로 데이터 액세스를 구현하는 중에, IDE 컨트롤러의 로그나 TE의 Debug 기능을 사용하여 디버깅할 수 있습니다.
# 1. SDK 로그 출력
TDAnalytics.enableLog(true);
# 2. Debug 모드 시작
TE의 Debug 기능을 이용하여, 디버깅을 수행할 수 있습니다. 디버그 기능은 다음의 2단계로 이용할 수 있습니다.
- DebugConsumer를 사용
다음은 DebugConsumer의 코드 예시입니다:
/*
DebugConsumer: Data is reported item by item. When a problem occurs, the user will be prompted with logs and exceptions; it is not recommended to use it in an online environment
The third parameter identifies whether to enter the warehouse, true indicates the warehouse, and false indicates not to enter the warehouse
 */
TDAnalytics te = new TDAnalytics(new DebugConsumer(SERVER_URI, APPID,true));
String deviceId = "te_device_id";
//set properties
Map<String,Object> properties = new HashMap<String,Object>();
properties.put("name", "shoes");
try {
     te.track("account_id","distinct_id","payment",properties);
} catch (Exception e) {
     System.out.println("except:"+e);
}
- TE 백엔드에 Debug 디바이스 추가
- TE 시스템 내에서 Debug 디바이스를 추가
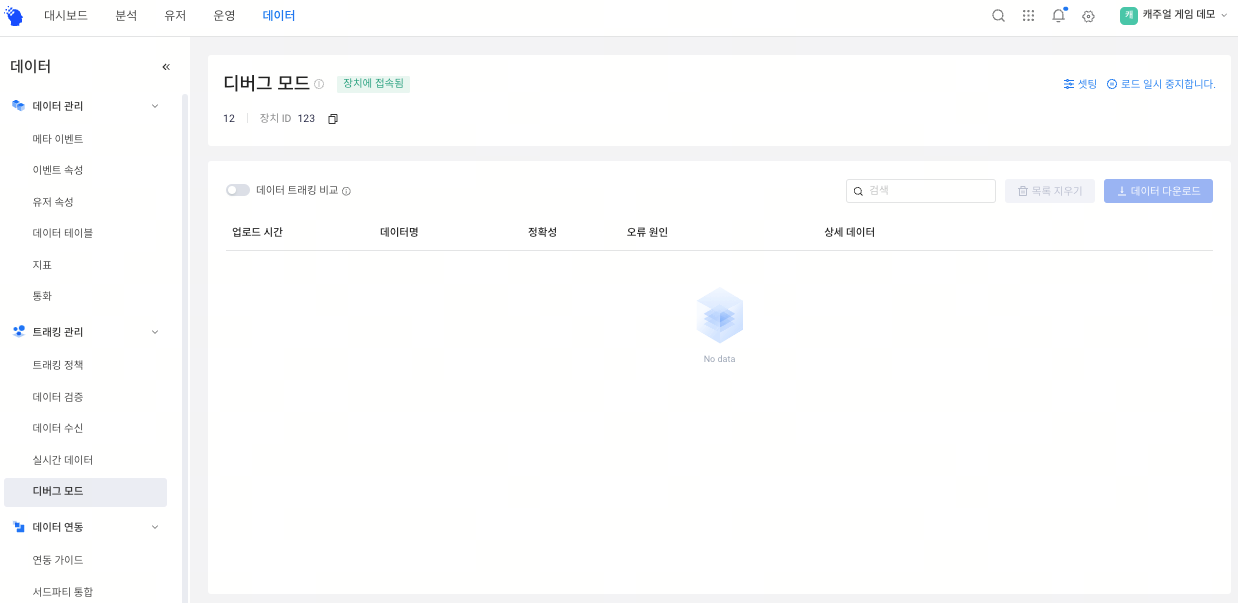
Debug 모드를 실제 환경에서 실수로 릴리스하는 것을 방지하기 위해, 특정 디바이스에서만 Debug 모드를 활성화할 수 있습니다.
클라이언트에서 Debug 모드를 시작하고, 디바이스 ID를 TE 시스템의 [데이터 관리] → [디버그 모드]에서 추가한 후 Debug 모드를 시작할 수 있습니다.
Debug 모드는 데이터 수집의 질과 앱의 안정성에 영향을 미칩니다. 따라서 데이터 검증을 위해서만 사용해 주세요.