# Operation Key Metrics
# 1. Overview
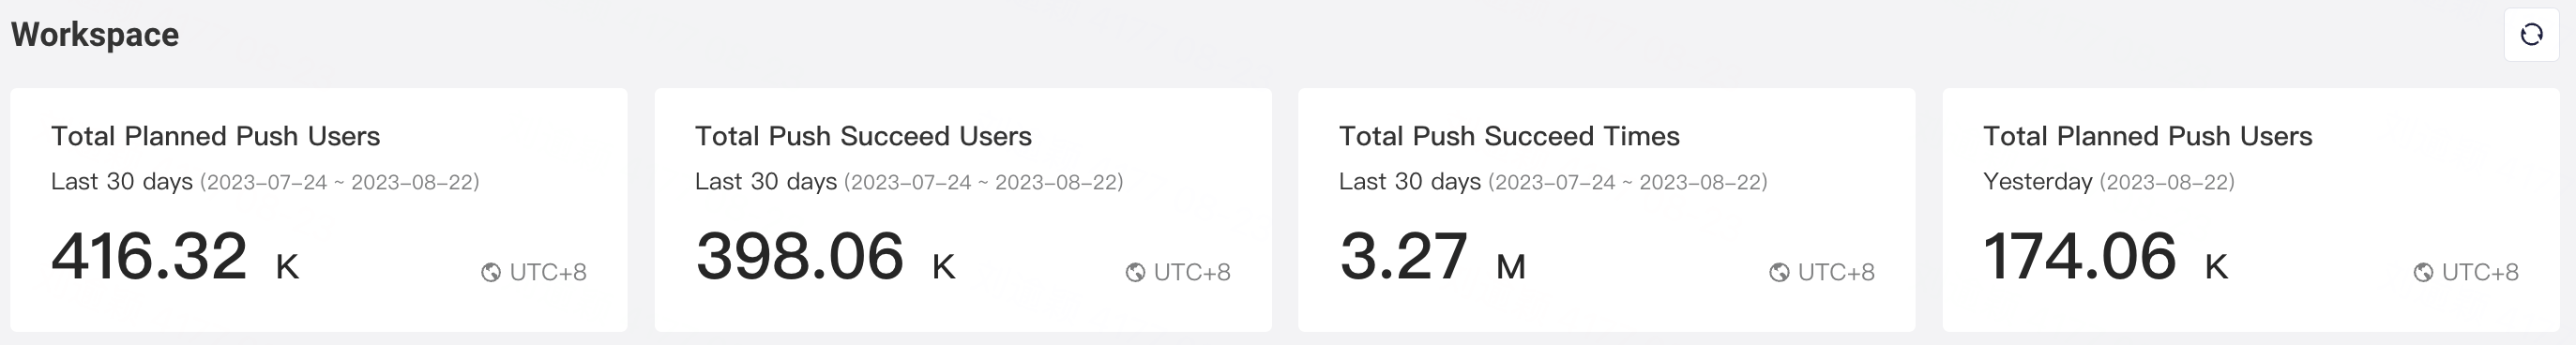
You can directly view the most critical operation metrics of this project on the Workspace, allowing you to quickly understand the overall operation performance of the project.
# 2. Use Instructions
# 2.1 Core Event Settings
In order to obtain the corresponding preset metrics on the dashboard, you need to first configure the relevant events in the Core Events Settings.

# 2.2 Metric Configuration
Due to the different metrics that different projects focus on, we provide a slot-based metric management capability. Workspace supports a total of four metric slots, allowing you to monitor on your most used metrics.
Add a Metric
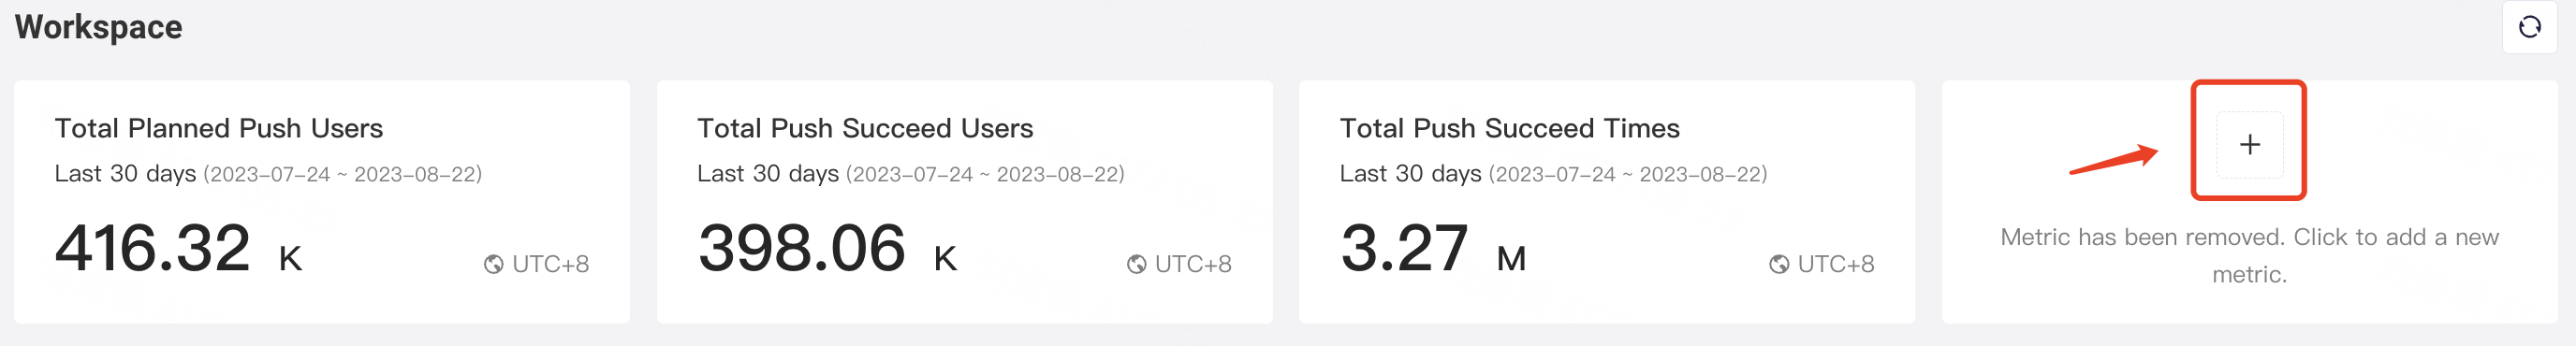
You can add new metrics by clicking the plus sign (+) on the metric card.
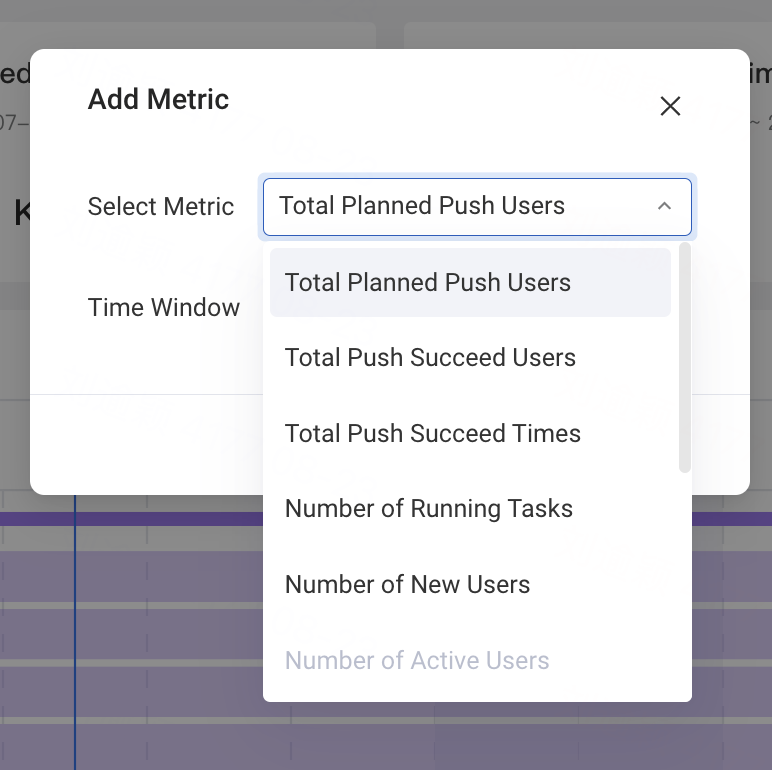
Then, you can select the metric and the time window, and save it to view on your workspace.
- After clicking on the edit button, you can modify the metric and time window.
- You can delete a card by removing the metric.
- The configuration of the metric card is personalized for the user.
- Hover on the upper right corner of the card and you may click to update the metric by re-calculating the metric value.
Basic information about metrics
- Metric Name: Displays the name of the selected metric.
- Metric Timezone: The timezone used for calculating the metric.
Note:
- If the user has not enabled the timezone, the metric timezone is the server timezone by default.
- If the user has enabled the timezone and selected 'local time' as the default timezone, the metric will not display timezone information.
- If the user has enabled the project timezone, the timezone on the indicator will be adjusted to the project default timezone for unified calculation.
- Metric Date Window: Provides corresponding calculation windows for the selected metrics (yesterday, today, last week, this week, last month, this month, past 7 days, lastest 7 days, past 30 days, lastest 30 days).
- Metric Value: The specific value of the metric calculated based on the selected date window.
# 2.3 Metric Definition and Time Window
A total of 12 preset metrics are provided, each of which can be used for display on a metric card. Among them, 8 metrics require configuration of core events before they can be used.
| Metric Name | Core Event | Unit | Time Window | Metric Meaning |
|---|---|---|---|---|
| Total Planned Push Users | / | person | yesterday, today, last week, this week, last month, this month, past 7 days(T+1), latest 7 days(T), past 30 days(T+1), latest 30 days(T) | During the statistical period, the number of unique users in the target audience after deduplicating the sent IDs and applying frequency control filtering. |
| Total Push Succeed Users | / | person | yesterday, today, last week, this week, last month, this month, past 7 days(T+1), latest 7 days(T), past 30 days(T+1), latest 30 days(T) | During the statistical period, the total number of unique individuals who were successfully reached through the messaging channel. |
| Number of Running Tasks | / | unique | current | The total number of ongoing operation tasks in the current project. |
| Total Push Succeed Times | / | person | yesterday, today, last week, this week, last month, this month, past 7 days(T+1), latest 7 days(T), past 30 days(T+1), latest 30 days(T) | During the statistical period, the total number of successful deliveries through messaging channel sending interface. |
| Number of New Users | New User Event | person | yesterday, today, last week, this week, last month, this month, past 7 days(T+1), latest 7 days(T), past 30 days(T+1), latest 30 days(T) | During the statistical period, the number of users after deduplication who performed 'new event' actions. |
| Number of Active Users | Active Event | person | yesterday, today, last week, this week, last month, this month, past 7 days(T+1), latest 7 days(T), past 30 days(T+1), latest 30 days(T) | During the statistical period, the number of unique users who performed 'active event' actions. |
| Number of Paid Users | Top-up Event | person | yesterday, today, last week, this week, last month, this month, past 7 days(T+1), latest 7 days(T), past 30 days(T+1), latest 30 days(T) | During the statistical period, the number of unique users who performed 'top up' actions. |
| Active User Paid Rate | Active Event Top-up Event | % | yesterday, today, last week, this week, last month, this month, past 7 days(T+1), latest 7 days(T), past 30 days(T+1), latest 30 days(T) | During the statistical period, the ratio of top-up users to active users. |
| New User First Day Pay Rate | New User Event Top-up Event | % Weighted average | yesterday, today, last week, this week, last month, this month, past 7 days(T+1), latest 7 days(T), past 30 days(T+1), latest 30 days(T) | During the statistical period, the proportion of new users who made a top-up event on their first day. |
| Pay Rate of Push Succeed Users | Top-up Event | % Weighted average | yesterday, today, last week, this week, last month, this month, past 7 days(T+1), latest 7 days(T), past 30 days(T+1), latest 30 days(T) | During the statistical period, the proportion of top-up users among the users who received push notifications. |
| Day 1 Retention Rate of New Users | New User Event Active Event | % Weighted average | the day before yesterday, last week, this week, past 7 days, past 14 days, past 30 days | During the statistical period, the average retention rate of new users on the following day. |
| Day 1 Retention Rate of Active Users | Active Event | % Weighted average | the day before yesterday, last week, this week, past 7 days, past 14 days, past 30 days | During the statistical period, the average retention rate of active users on the following day. |
# 2.4 Permissions
Users with "Edit" permission of "Operation Settings" can edit and delete the core events.
The current Engage Roles include:
- Operation Admin
- Operation
- Data Engineer
Operation Admin has the permission to set core events.
| Functions | Permissions | Details |
|---|---|---|
| Operation Settings | View | View fatigue control rules, approval settings, whitelist, locale settings and core event settings. |
| Edit | Edit fatigue control rules, approval settings, whitelist, locale settings and core event settings. |
Operation and data engineers only have the permission to view core events.
| Functions | Permissions | Details |
|---|---|---|
| Operation Settings | View | View fatigue control rules, approval settings, whitelist, locale settings and core event settings. |