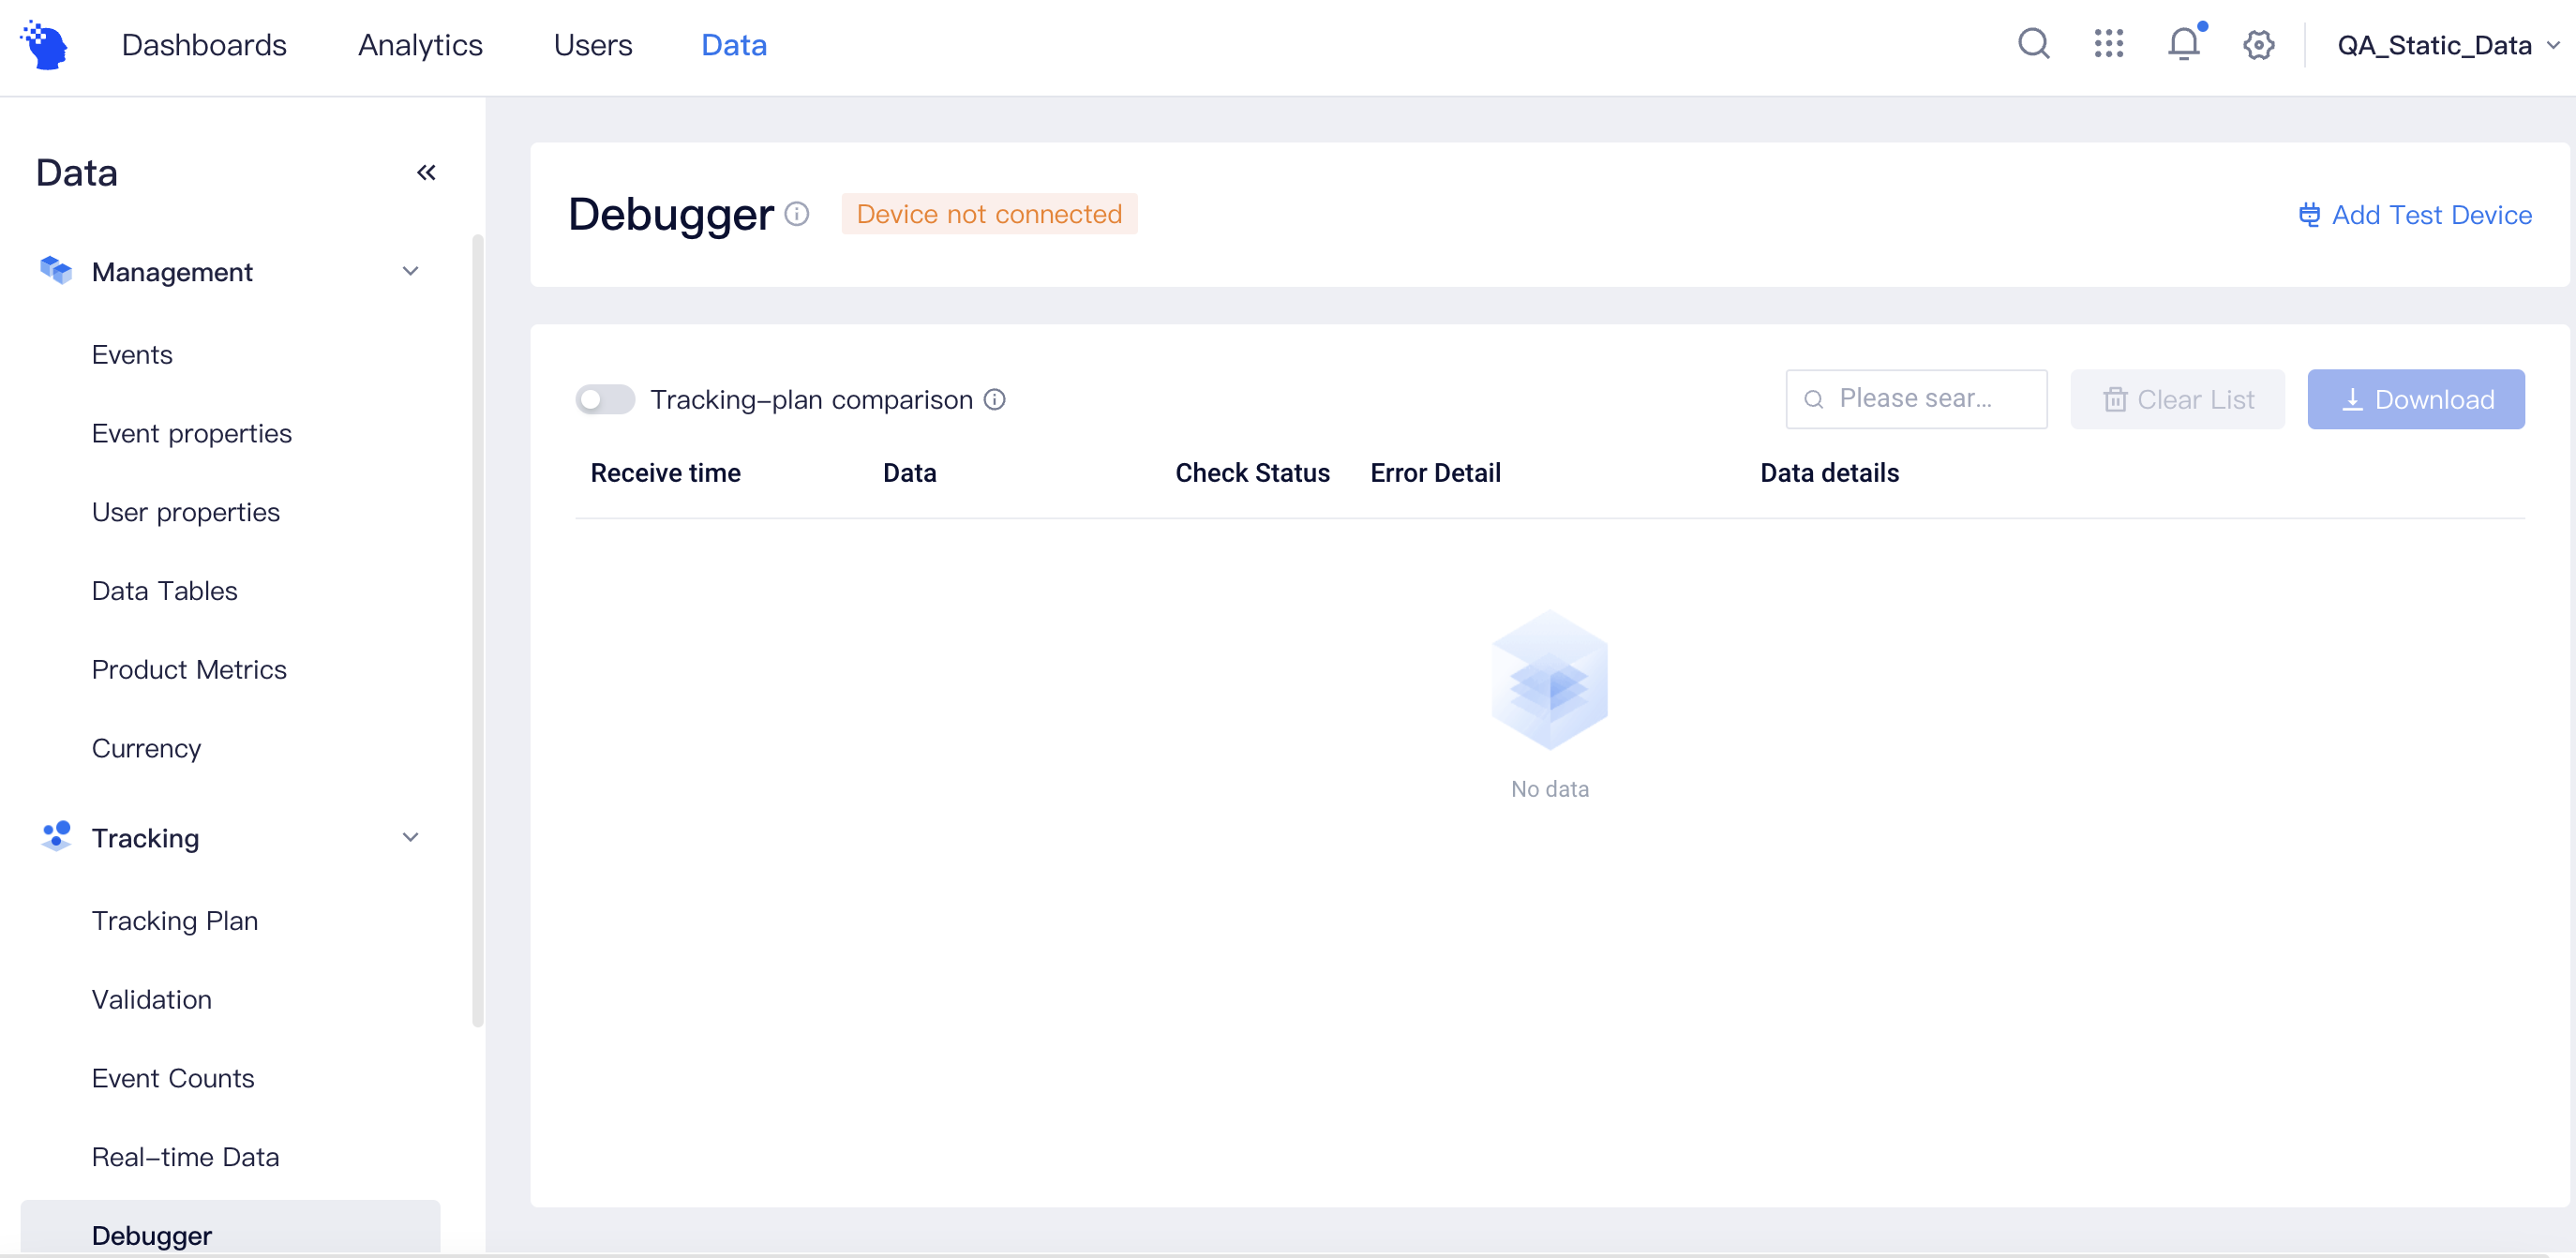
# Debugger
The Debugger is designed to make it easy for developers to debug data reporting and is only used for data validation during the integration phase. Please note that the Debugger may affect the quality of data acquisition and stability of the APP. Please do not use it in the online environment.
# Enable the Debugger
(1)Android SDK
The Android SDK instance supports three operation modes and is defined in TDConfig. Please select theDEBUGorDEBUG_ONLYmode:
/**
 * Instance operation mode, which is the NORMAL mode by default.
 */
public enum ModeEnum {
    /* In Normal mode, data will be stored in the cache and reported as per a certain cache strategy */
    NORMAL,
    /* Debug Debug mode, data is reported in an entry-by-entry manner. When a problem arises, the system will notify the user in the form of a log and exception */
    DEBUG,
    /* Debug Only Only mode only verifies data without storing the data */
    DEBUG_ONLY
}
For example, the following codes work to initialize SDK using the Debug Mode:
// Acquire TDConfig instance
TDConfig config = TDConfig.getInstance(mContext, TA_APP_ID, TA_SERVER_URL);
// Set operation mode as the Debug Mode
config.setMode(TDConfig.ModeEnum.DEBUG);
// Initialize SDK
instance = ThinkingAnalyticsSDK.sharedInstance(config);
(2)iOS SDK
iOS SDK instance supports three operation modes and is defined in TDConfig. Please select theDEBUG or DEBUG_ONLYmode:
/**
Debug Mode

- ThinkingAnalyticsDebugOff: Debug Mode is not enabled by default
*/
typedef NS_OPTIONS(NSInteger, ThinkingAnalyticsDebugMode) {
    /**
     Debug Mode is not enabled by default
     */
    ThinkingAnalyticsDebugOff      = 0,

    /**
      Debug_only mode is enabled, which only verifies data without storing it.
     */
    ThinkingAnalyticsDebugOnly     = 1 << 0,

    /**
     Debug Mode, data will be reported in an entry-by-entry fashion. When a problem arises, the system will notify the user in the form of a log and exception
     */
    ThinkingAnalyticsDebug         = 1 << 1
};
For example, the following code uses Debugger to initialize SDK:
// Acquire TDConfig instance
TDConfig *config = [[TDConfig alloc] init];
// Set operation mode as the Debug Mode
config.debugMode = ThinkingAnalyticsDebug;
// Initialize SDK
ThinkingAnalyticsSDK *instance = [ThinkingAnalyticsSDK startWithAppId:@"YOUR_APPID" withUrl:@"YOUR_SERVER_URL" withConfig:config];
(3) Other clients
# Add Test Device
To avoid launching the Debugger in the production environment, the mode can only be enabled when specifying a device. Only when the Debugger is enabled by the client and the implement is configured in Tracking - Debugger can the Debugger be enabled.
The device ID can be acquired in the following two ways:
- Client log: Upon the completion of SDK initialization, equipment
DeviceIdwill be printed. - The device ID can be obtained by invoking
getDeviceId.
# Instructions
When connecting the device, data reported by the device will be displayed on the data sheet in real time, and with respect to error data found in verification, the specific causes will be given to facilitate troubleshooting.
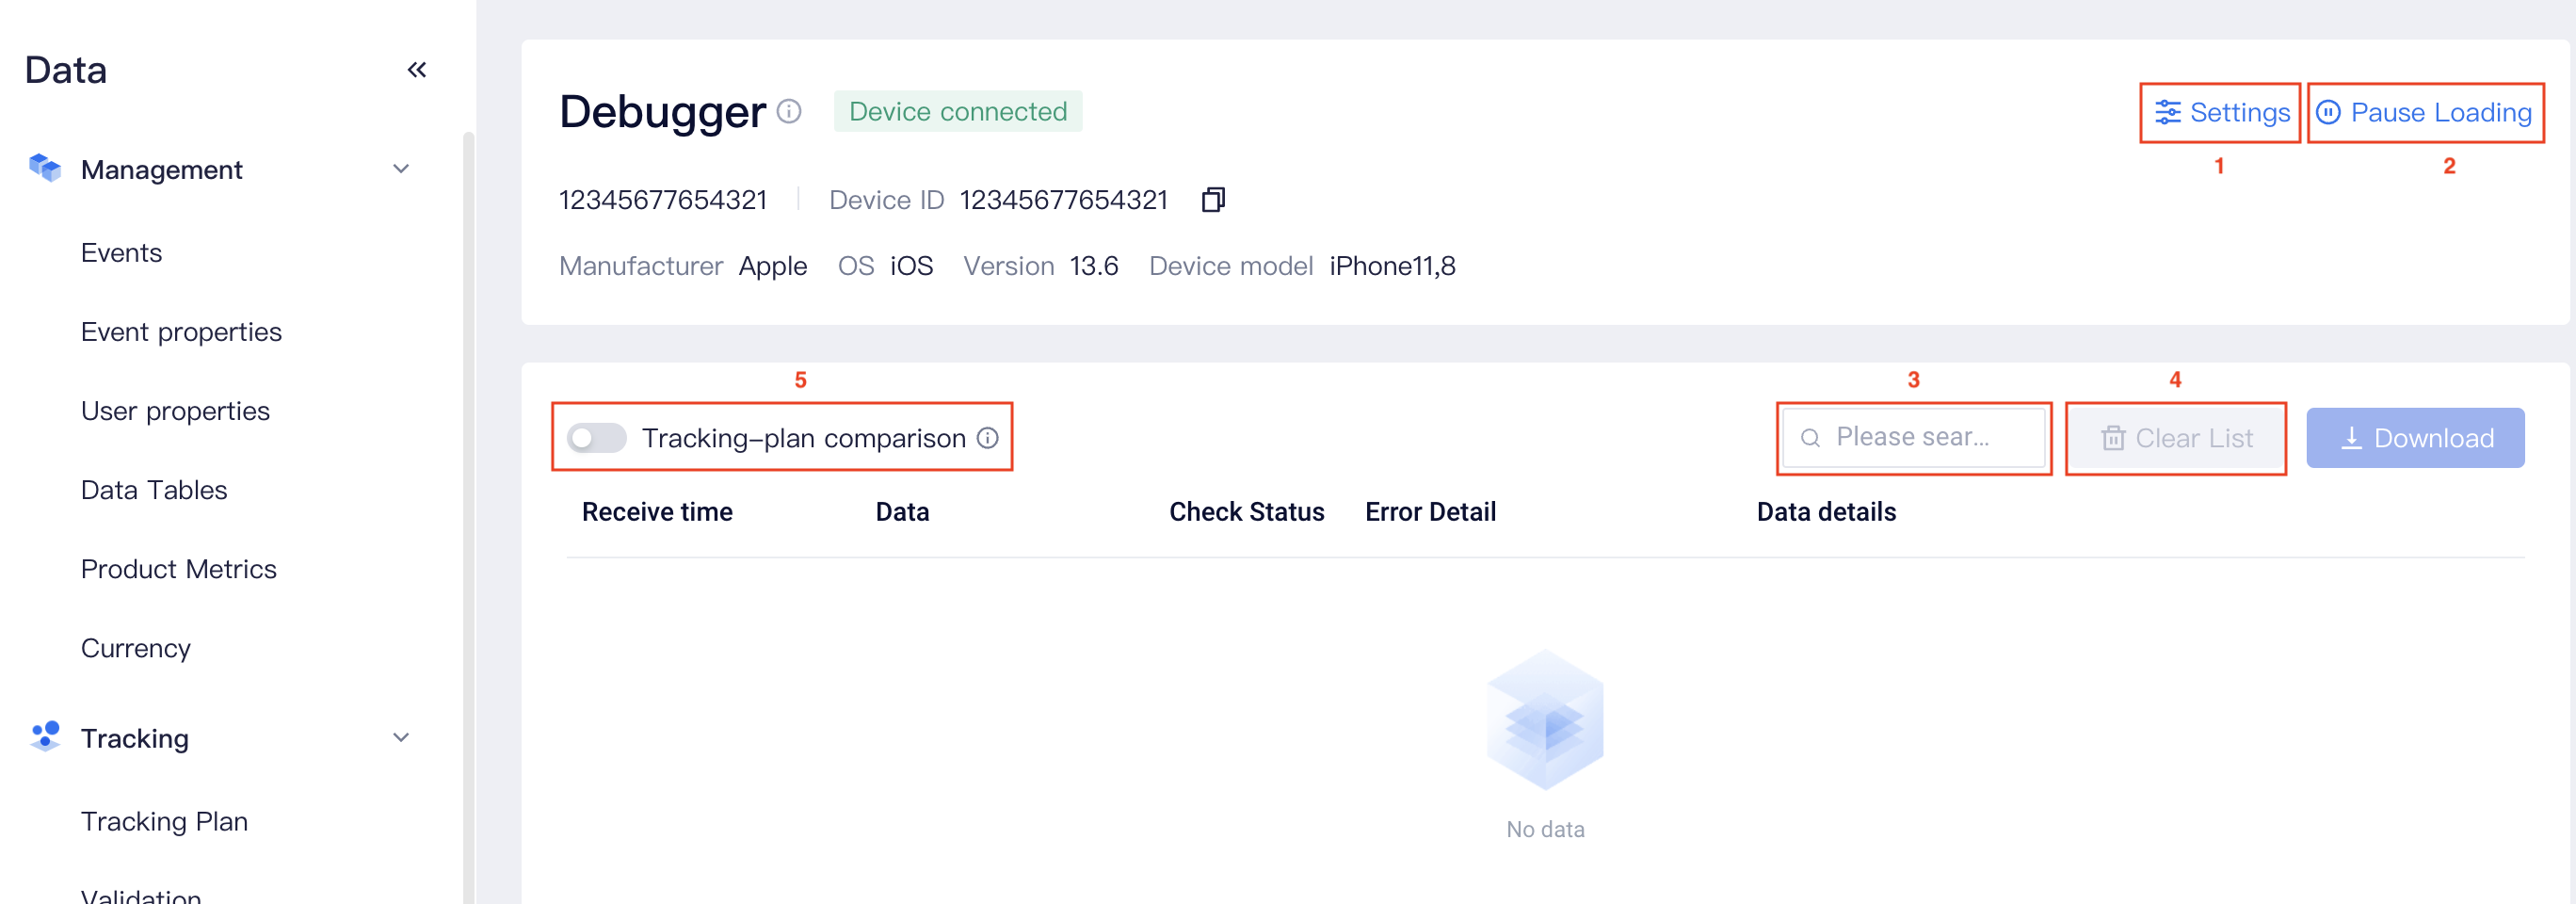
- Settings: Click to switch the current connected device or add a new device;
- Pause loading: If you want to stop at a certain current event for further processing during the test process, you can click 「Pause Loading」. Data generated in the paused state (e.g., Auto Acquisition event) will be notified on top of the data sheet. Click 「Start Loading」 and you will be switched to a real-time loading state.
- Search event: The search filter only displays specified events or user properties.
- Clear list: Click 「Clear List」and you can clear the current data list. Cleared data will no longer be displayed. The clearing operation will only clear the logs without deleting events that have already been saved in the database.
- Tracking-plan comparison: If you have maintained the information of the data tracking plan at Tracking - Tracking Plan Module prior to data testing, you can select to enable 「Tracking-plan comparison」, that is, to obtain the difference between test data and data tracking plan during the test stage and timely adjust data tracking codes.
After the tracking-plan comparison is enabled, returning to error information based on the data tracking plan will be added to error causes (comparison does not include preset properties). Potential errors include:
- The event is not in the data tracking plan,
- The event is not in the data tracking plan but there are reported properties,
- There are missed properties, that is, the event is in the data tracking plan but no properties are reported,
- The types of reported properties are not consistent with those in the data tracking plan.
# Best practices
# 4.1 Use the Debug Mode to debug data tracking
The Debug Mode is highly suitable for verifying the correctness of the newly created data tracking plan. Prior to testing data tracking, the device ID #device_id in TE SDK will be acquired and the device will be added to the Debug Mode. After that, data tracking is triggered in IDE or your own device, and attention should be given to data presented in the Debug Mode, especially whether data has been uploaded and whether data is correct.
# 4.2 Enable data tracking comparison
After uploading the plan on the Tracking Plan page, you can select to enable 「Tracking-plan comparison」, that is, to obtain the difference between test data and data tracking plan during the test stage and timely adjust data tracking codes. Please note that the verification results of this feature do not cover preset properties.