# Annotations
You can mark milestones of your project (e.g., version update, major event’s launch, etc.), and compare the changes in the metrics before and after the marked dates in charts and tables.
# 1. How to add an annotation
Members (Root, project admins and some analysts with permission) can addannotations:
- Directly in the trend chart of analysis model
- Via [Annotations] under [Applications] on the navigation bar
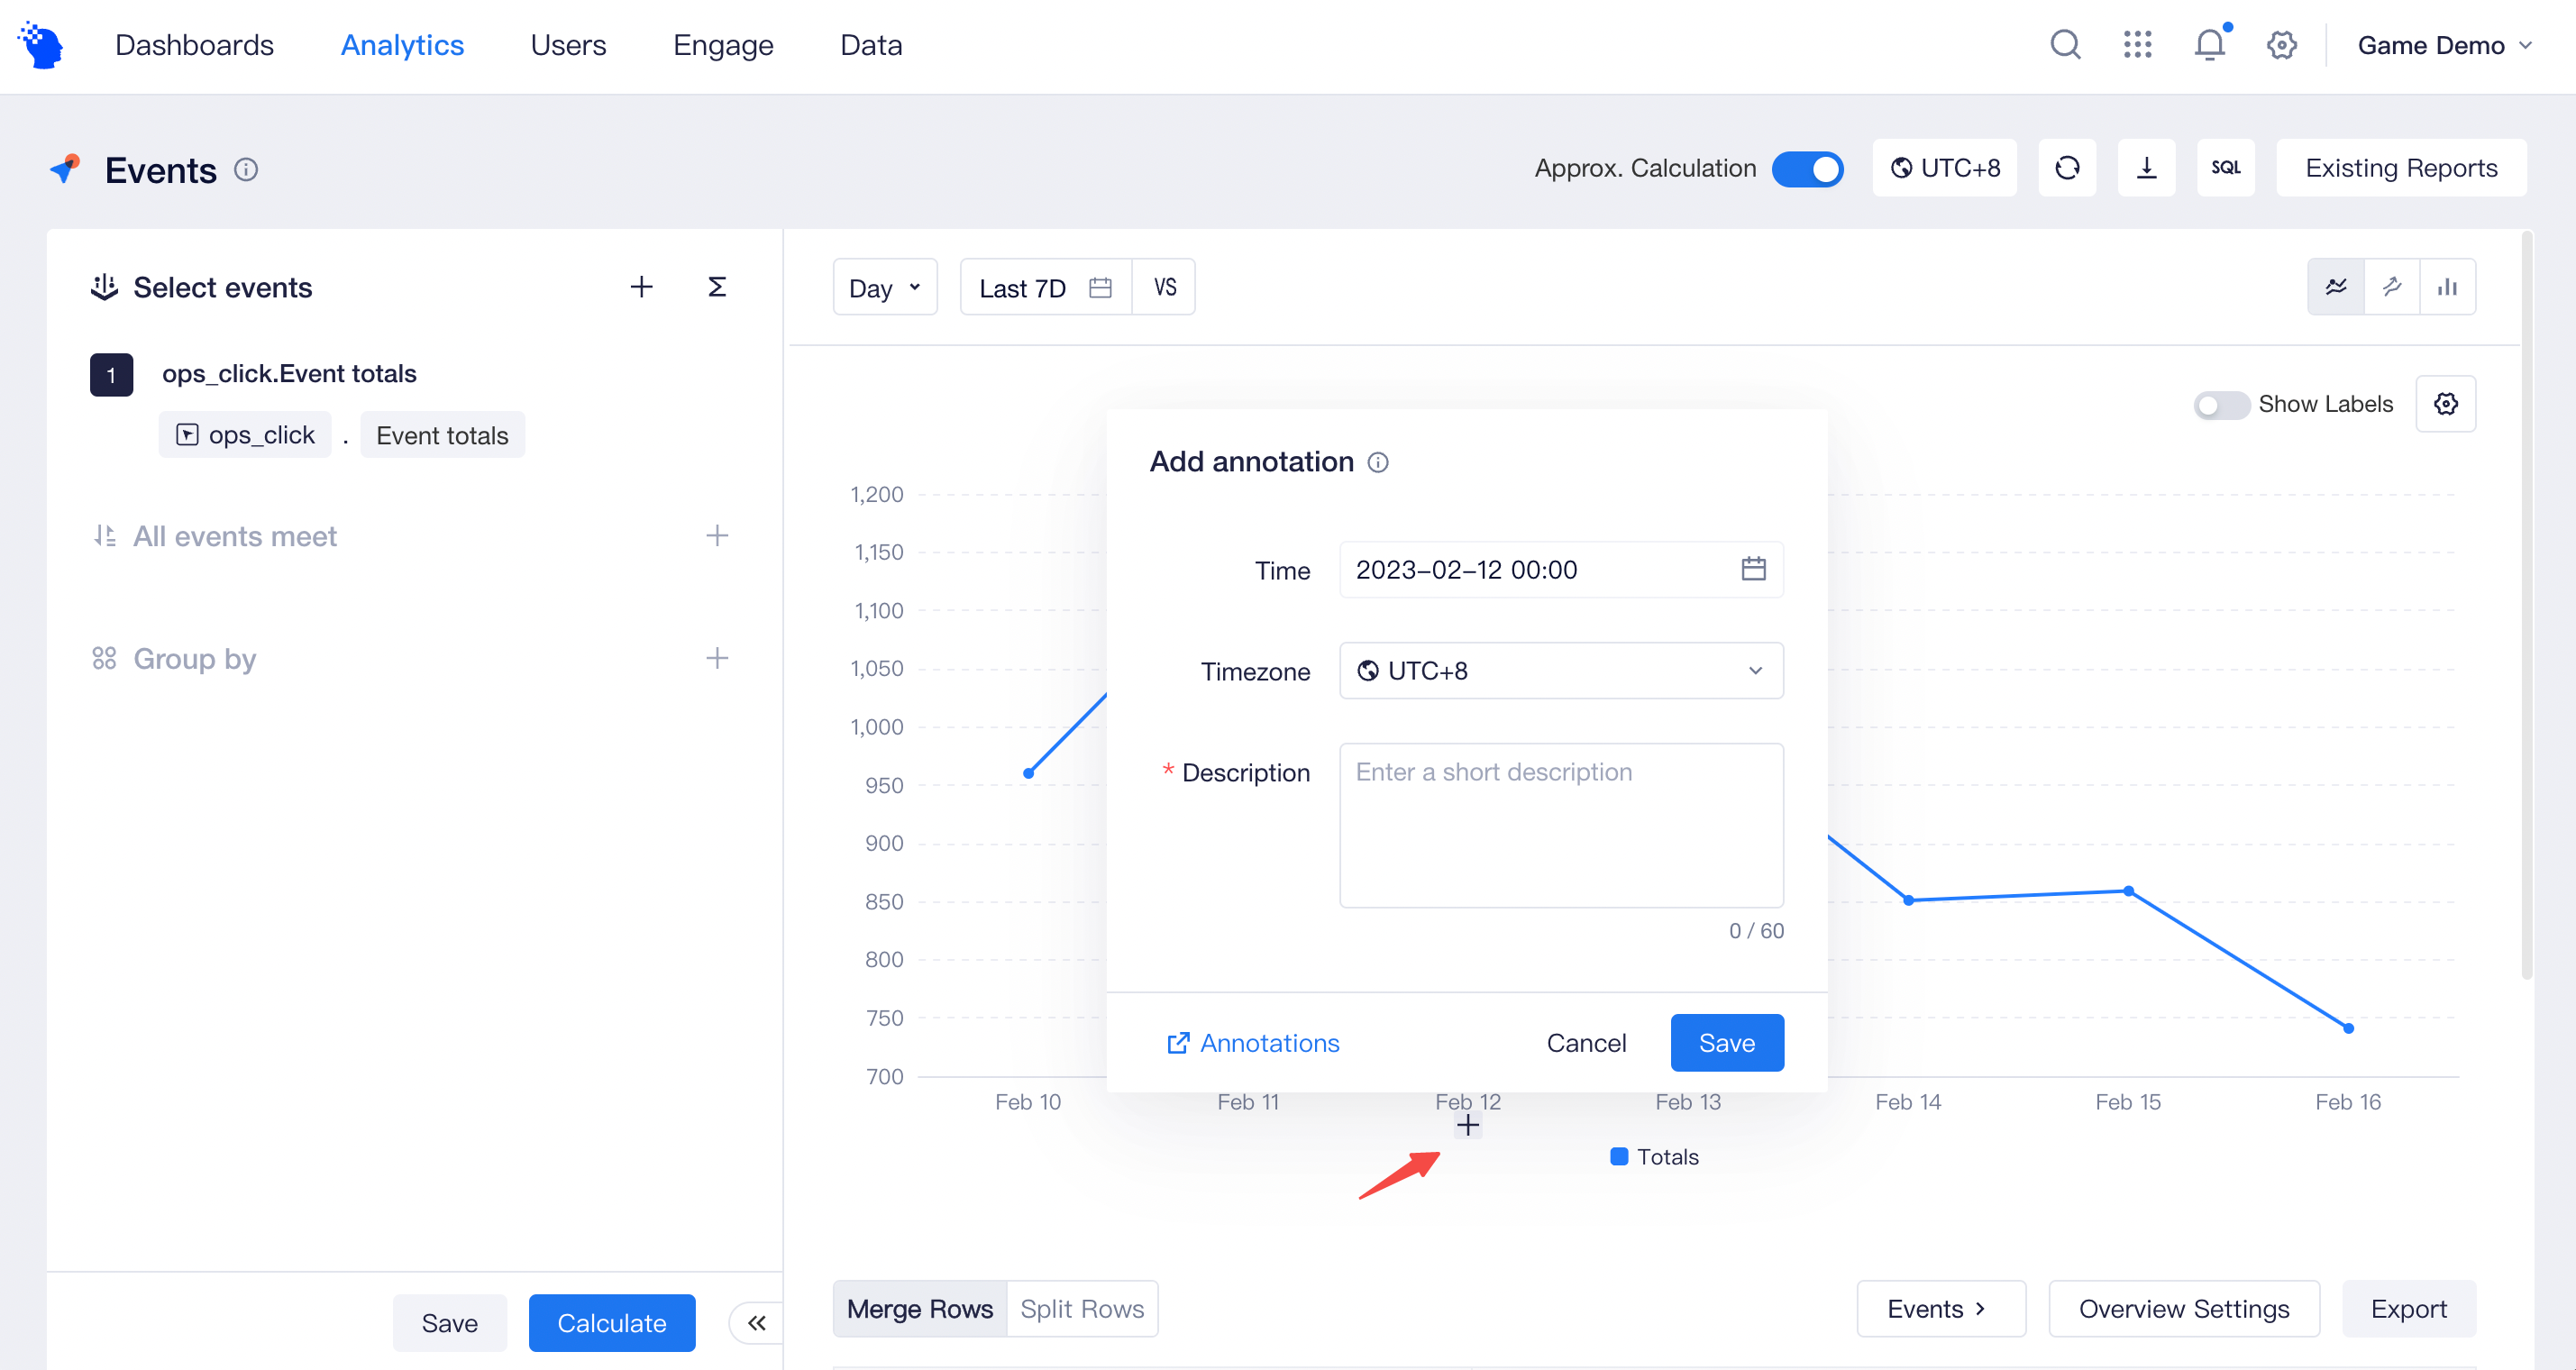
Method 1: Add directly in the trend chart of analysis model
- Hover the mouse pointer over the bottom of the trend chart and click the “Add Annotation” button to mark the date.
- Hourly granularity is supported.
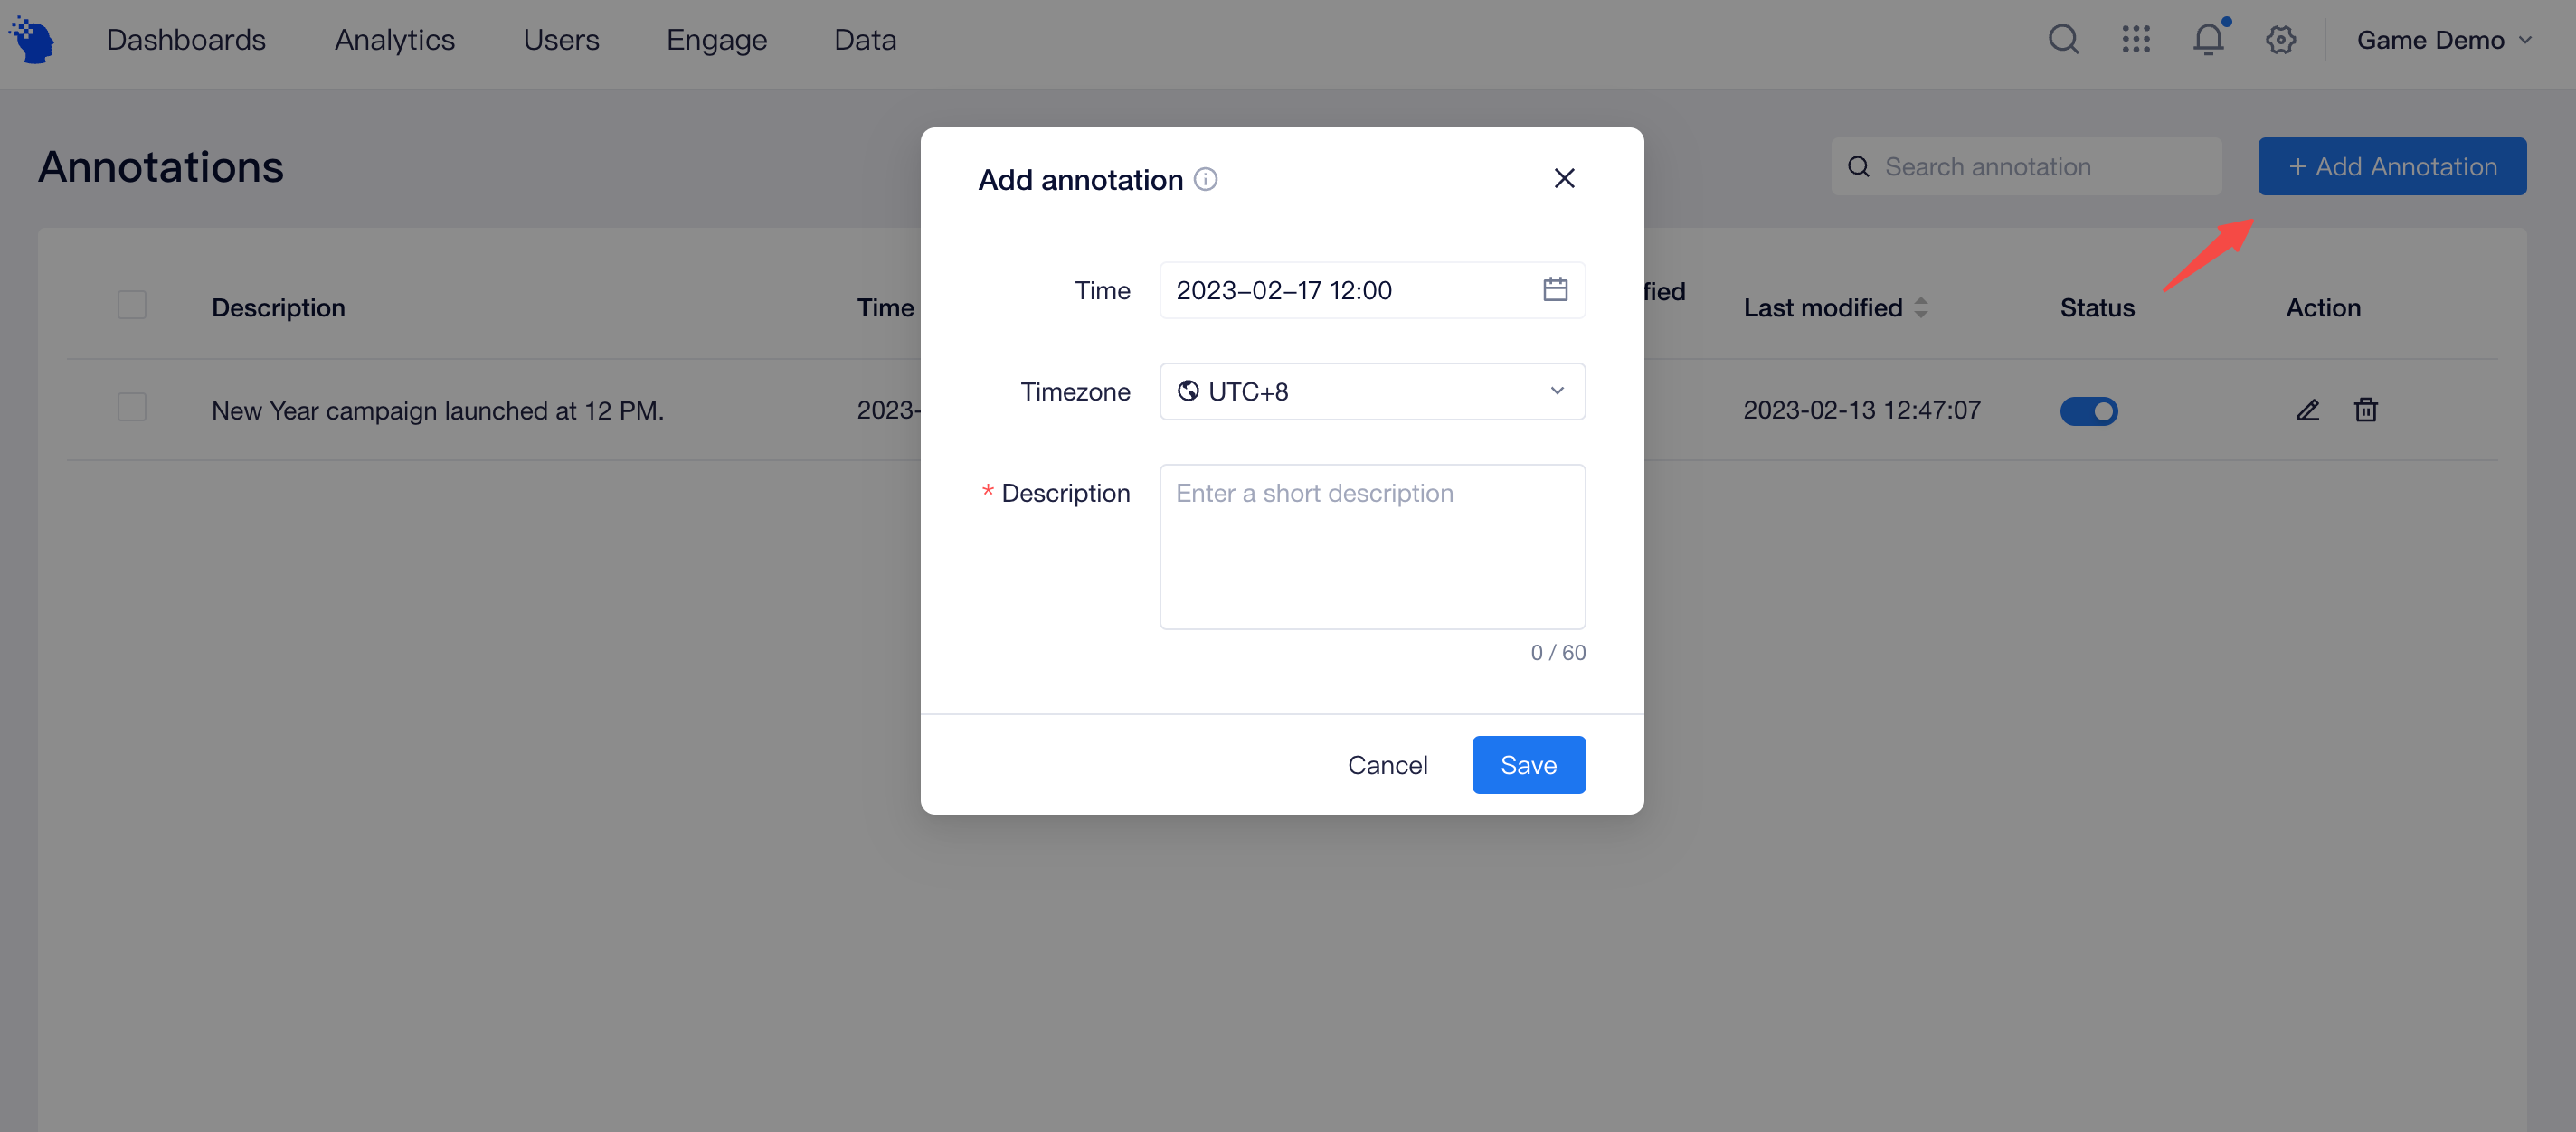
Method 2: Add via [Annotations] under [Applications] on the navigation bar
Click [Add Annotation] at the top right of the page, and add an annotation after entering the date and mark content.
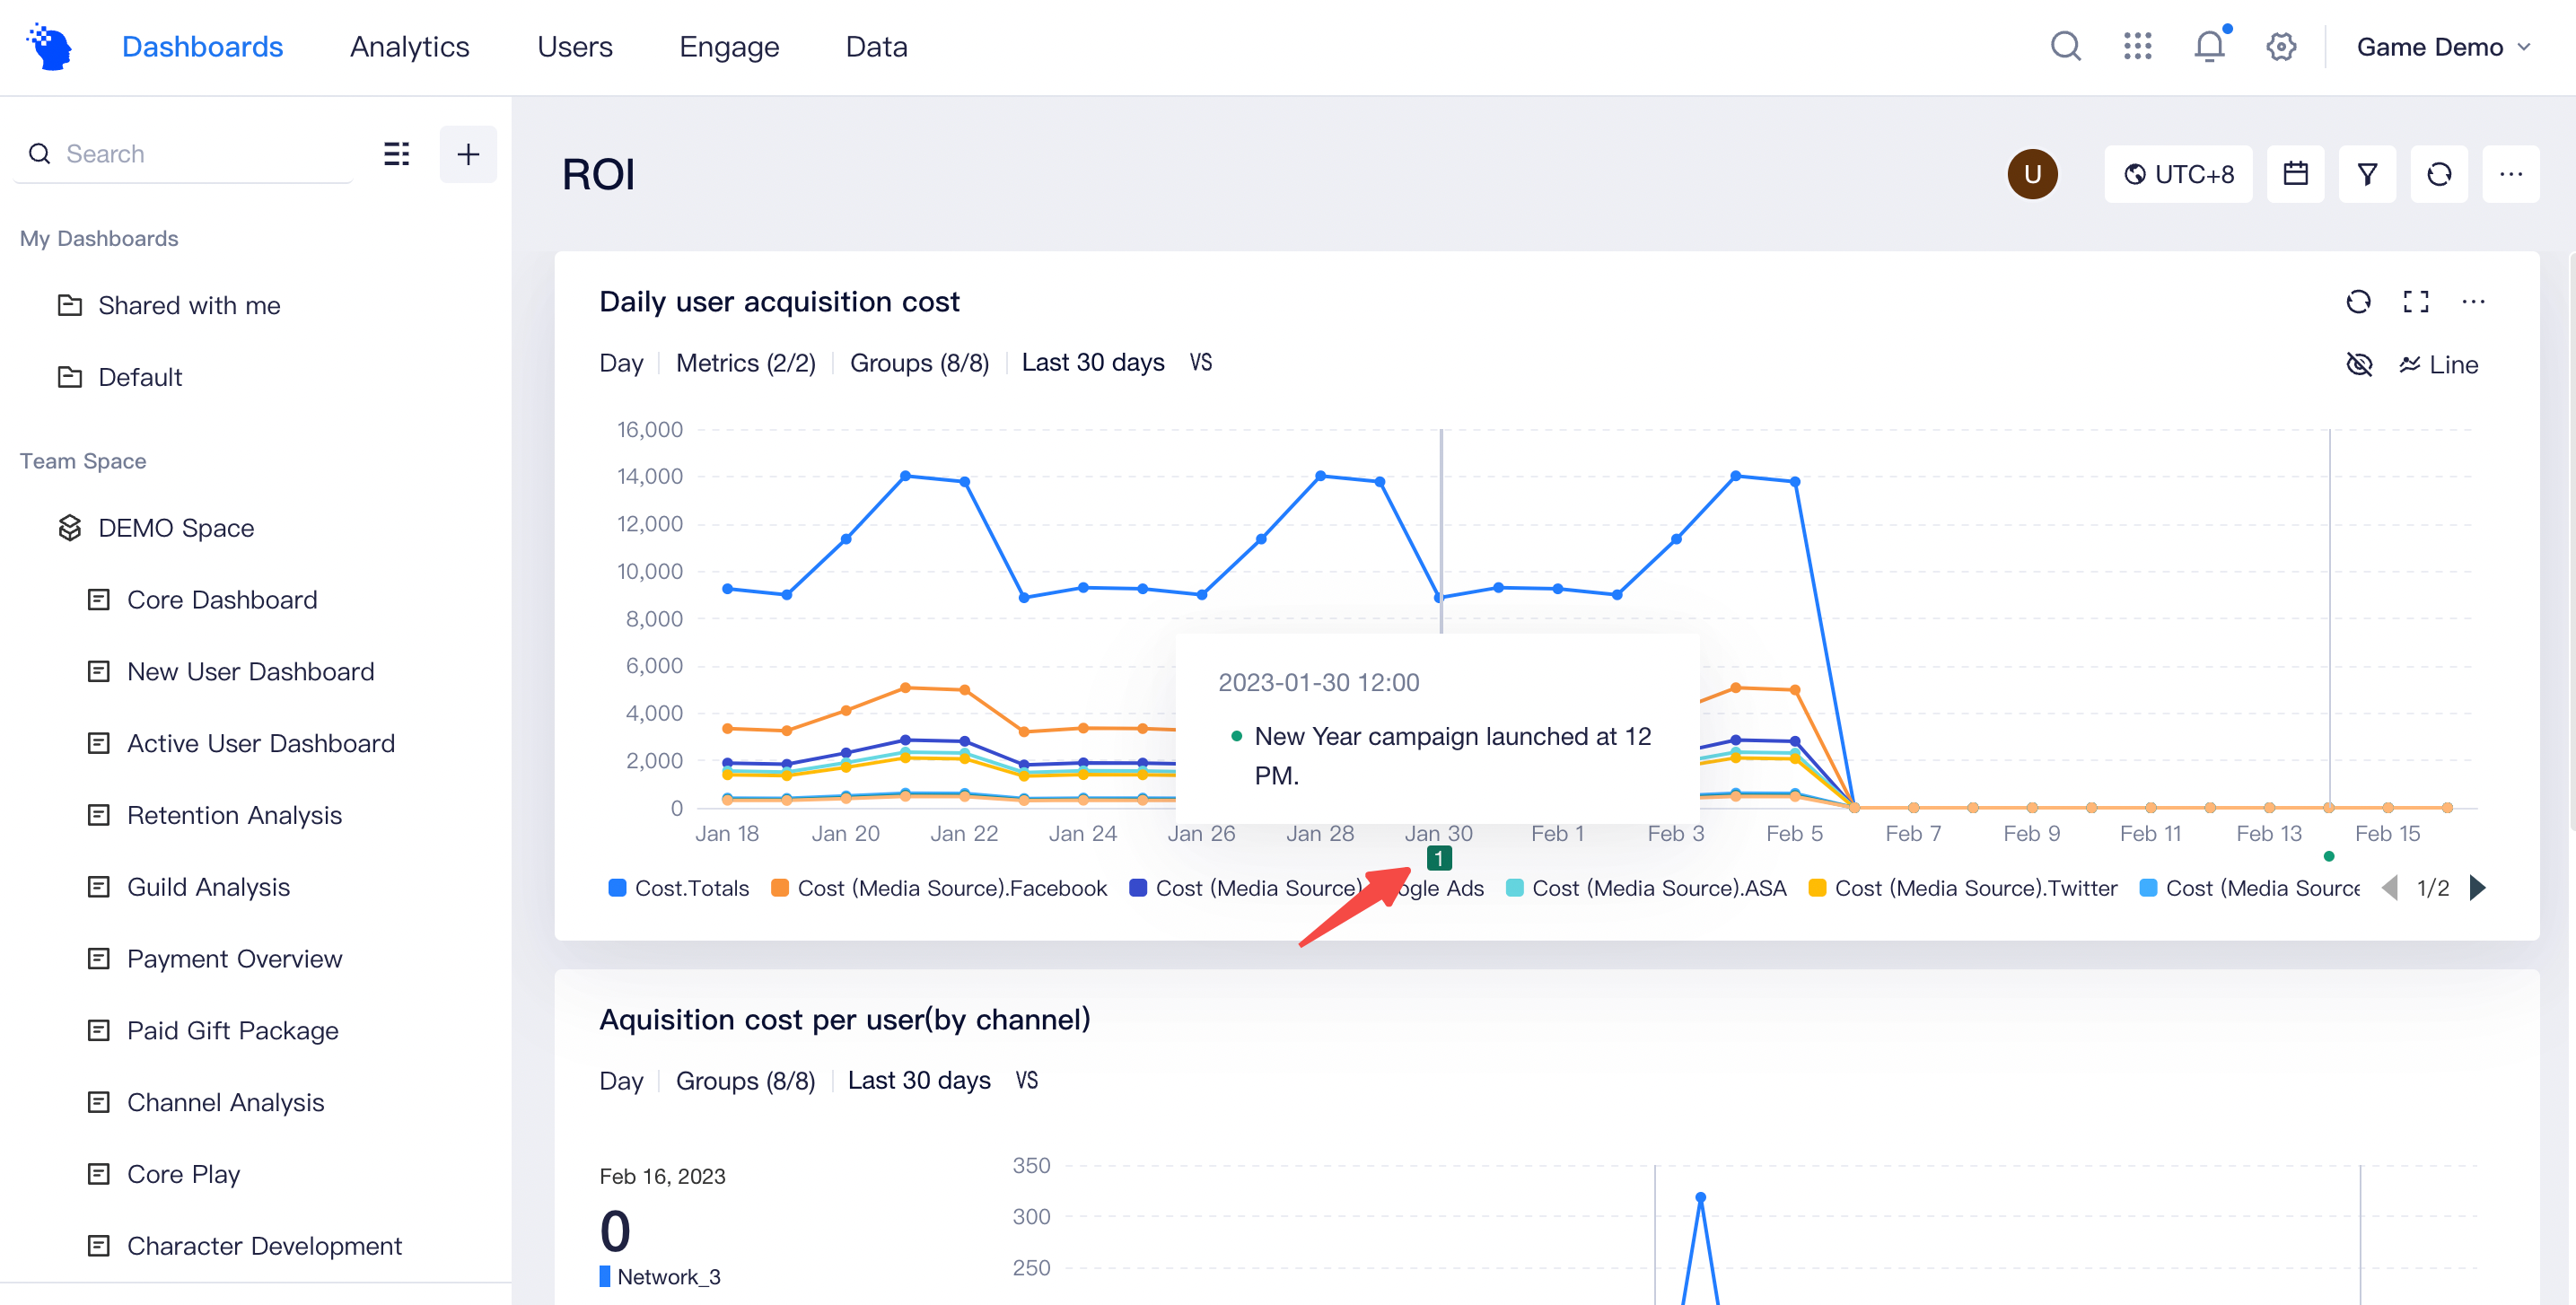
After adding annotations by either method, members of the project can view the marked date and information in the project trend chart (except SQL reports) to learn about changes of metrics before and after the date easily.
TIP
If your project has time zone settings enabled, when adding annotations, you need to specify the time zone for the date to be marked. In case of report, the marked date will be displayed according to the specified time zone.
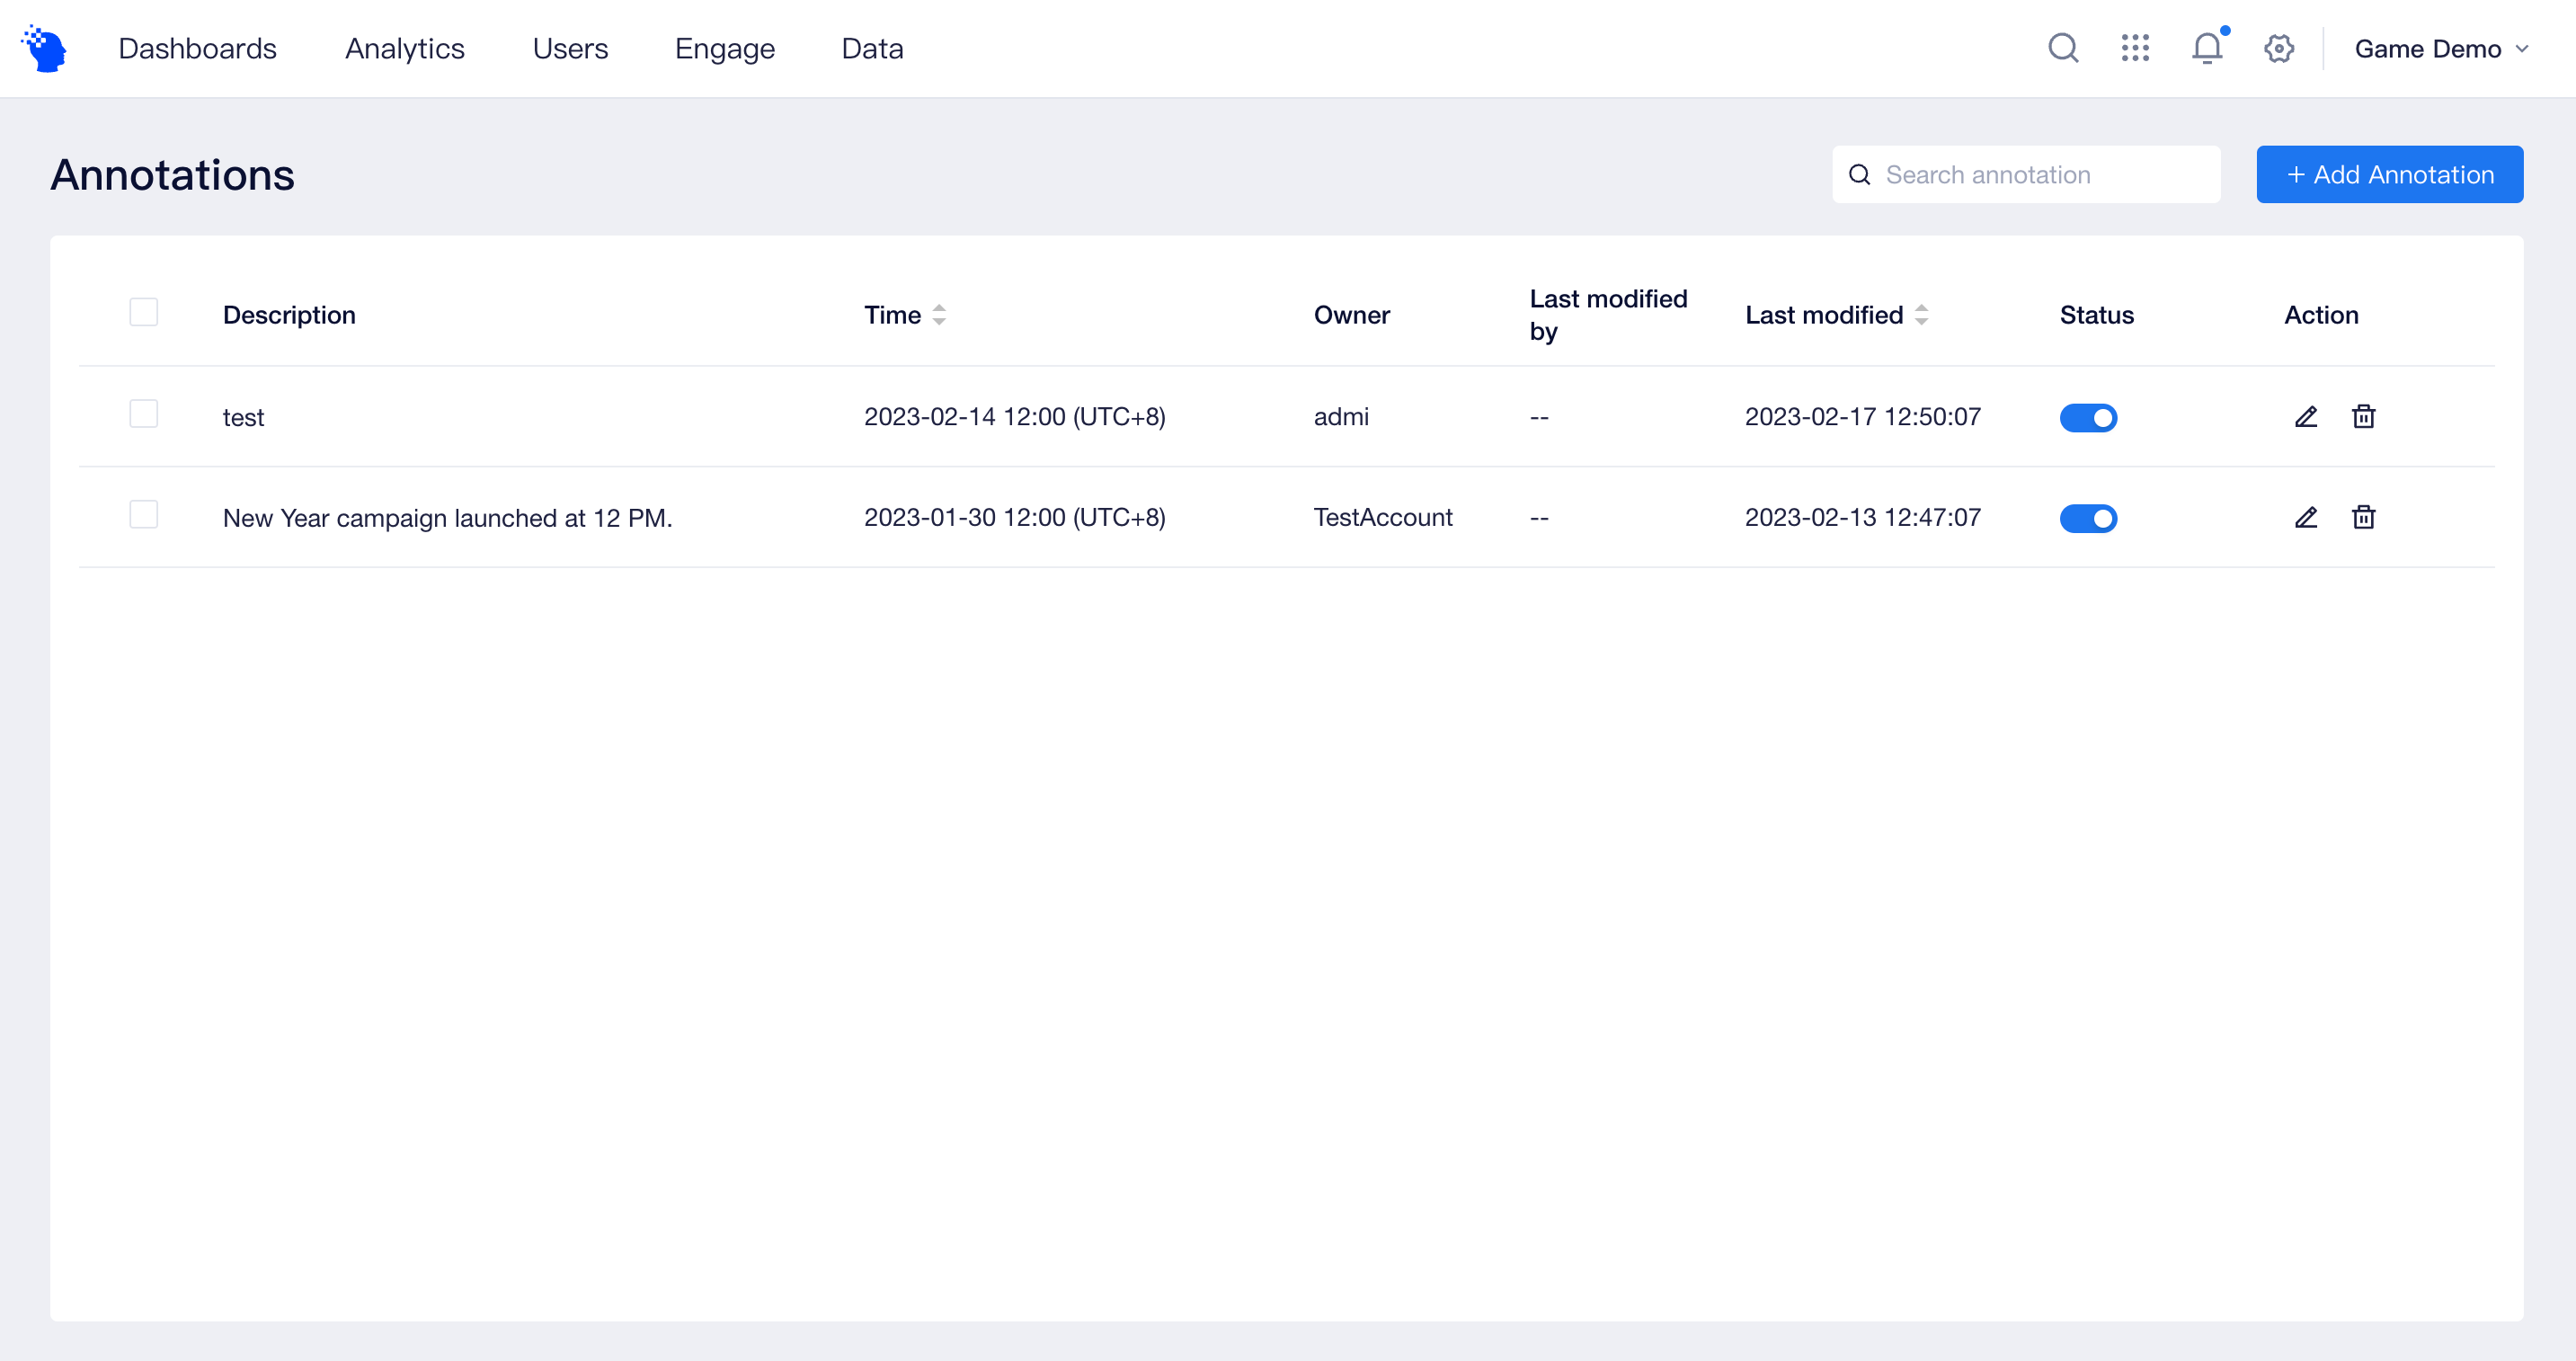
# 2. Annotations Management
On the [Annotations] page (navigation bar [Applications]→[Annotations]), you can manage all annotations of the current project by editing, setting display status or deleting them.