# A/B Testing
# 1.What is an A/B test?
A/B test is an experiment method that compares two or more different strategies, designs, or variations to determine which one has a greater impact on users or business. A/B test can help identify which group receives better user feedbacks, and has higher conversion rates, or better business performance.
In A/B test, the objects being tested will be randomly and equally divided into two (or more) groups: a control group and one or several experiment groups. The control group uses the current strategy or design, while the experiment group uses the modified strategy or design. Users in both the control group and the experiment groups are exposed to respective experiences at the same time.
By comparing user feedback, behavior, or business metrics between groups, it is possible to determine which group is more advantageous. Experiments can be used to validate your content changes, such as different push notification contents, different prices for game bundles, ways of reaching users, or functional changes.
The goal of A/B test is to make decisions based on actual data and user feedback. Through continuous testing and optimization, it gradually improves user experience, increases conversion rates, and enhances business revenue.
# 2. Overview
TE Engage Module supports A/B Test. By configuring multiple groups of content strategies for the same operation task, it helps operation specialists make scientific decisions on the optimal strategy to improve the target conversion effect.
# 3. Usage Instructions
# 3.1 Turn on A/B test
In the "Tasks" module, click on the "+ Create Task" button to enter the campaign creation interface.
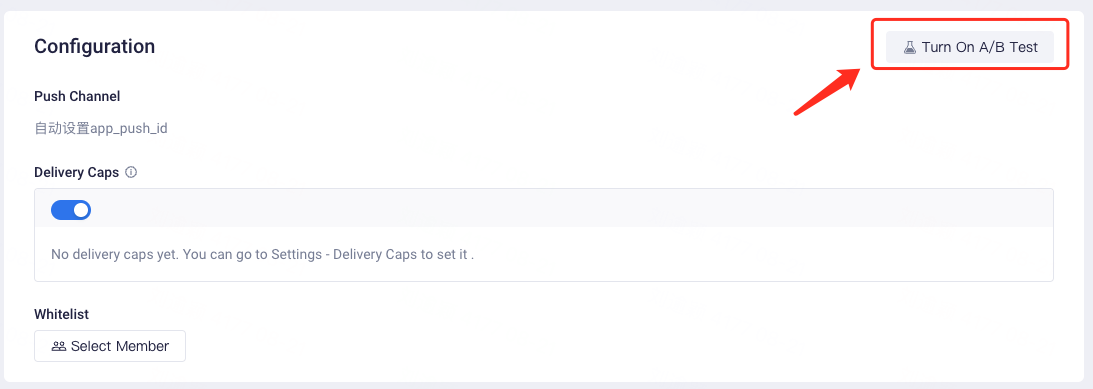
At this point, you can click on the "Turn on A/B Test" button in the Configuration section, which will enable the split testing settings for this task.
# 3.2 Test Configuration
- Sampling Ratio
After turning on the A/B test, you can manually set the test sampling ratio, also known as the gray sampling ratio. This refers to randomly selecting a certain percentage of users from the target audience to participate in the A/B test, while the remaining users will not be reached.
The sampling ratio can be selected as any integer value within the range (0, 100]. You can set it by dragging the scroll bar or entering the value manually.
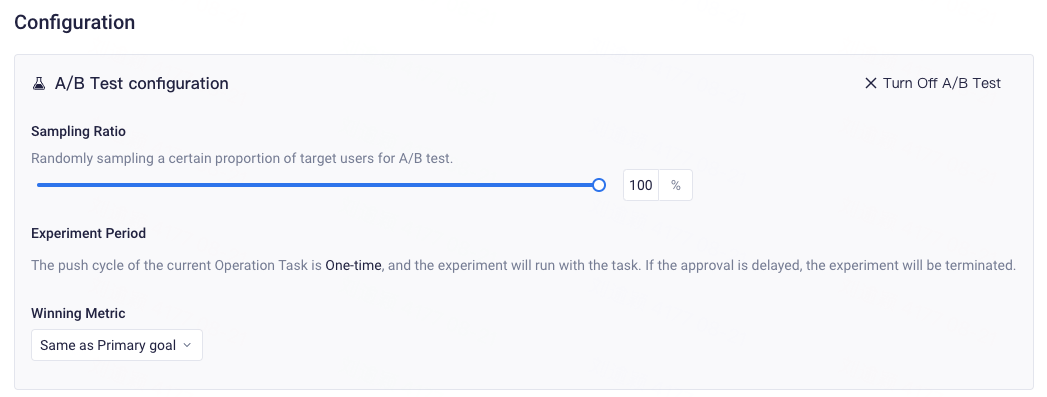
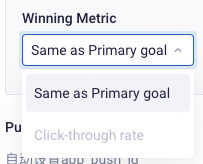
- Winning Metric
To continue, you should also set the winning metric for this A/B test. You can either align it with the "primary goal" of the operation task, or select "Click-through rate". Please note that for "click-through rate", you need to configure the "clicked" event in the Funnel Setting of the corresponding channel in channel management.
- Experiment Groups Configuration
After completing the above settings, you will also need to configure the push contents for the control group and experiment groups in Message.
The control group will use the current strategy or design, while the experiment group will use the modified strategy or design. Both groups of users will receive different versions of the content at the same time.
- Control Group
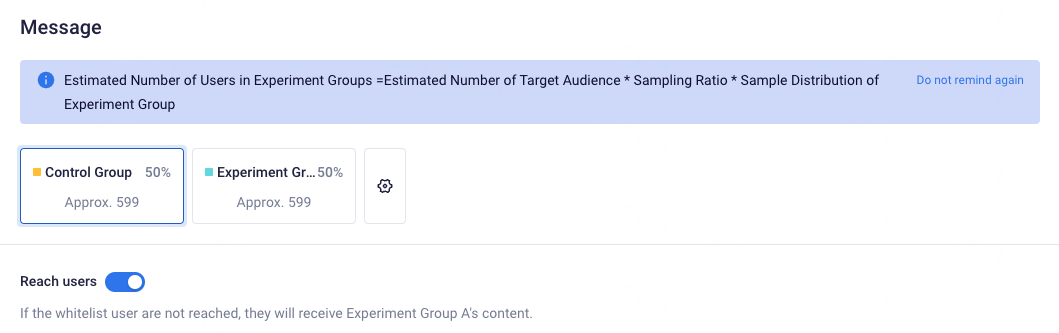
Each A/B test typically includes one control group, and you can choose whether to reach users in the control group.
When you choose to reach users in the control group, the control group will run the task simultaneously with the experiment groups, which allows you to observe feedback from users on different contents during the same period.
On the other hand, if you choose not to reach users in the control group, it can be used to evaluate the effectiveness of your operation strategies on users. You can observe whether the experiment group shows a significant improvement in target conversion compared to the control group.
- Experiment Group
You can set up to 4 experiment groups. You can click on the gear icon on the right side to configure experiment groups. This allows you to add or delete experiment groups and customize their names. Additionally, you can use the scroll bar to allocate sample distribution to each experiment group. The system will estimate the number of users of each experiment group based on your target audience, experiment sampling ratio, and sample distribution allocation.

# 4.Experiment Status
Tips: The "Operation Task Status" is the parent status of the "A/B test Status". The status of the operation task will affect the status of the test. For example, if the operation task is paused, the test will also be paused. If the operation task is finished, the experiment will also be finished, etc.
The operation task status includes 'Draft', 'Pending', 'Running', 'Paused', 'Finished', and 'Rejected'.
The test status describes the current state of the A/B test and includes the following:
- Not Started: The experiment in which the operation task is in a non-finished state and has not yet been pushed.
- Canceled: The experiment that has been closed before being pushed when a operational task becomes 'Finished'.
- In Progress: The experiment is still within the target conversion window while the operation task is in the 'Running' status.
- Paused: The experiment also enters the 'Paused' status when the operation task is in the 'Paused' state.
- Data Collecting: The operation task is in the 'Finished' status, but the target conversion window has not ended yet, and test results are still reporting and being collected.
- Report Completed: The operation task is in the 'Finished' status, and the experiment has reached the target conversion window. The A/B test report is completed and the experiment will be officially closed.
# 5. A/B Test Report
In the A/B test report module, users can visually compare the result data of the control group and each experiment group. This not only allows the team to determine the winning strategy based on statistis but also enables the team to dynamically observe the data trends throughout the entire experiment.
# 5.1 Report Access
Once the operation task for the A/B test has started, users can view the test result data on the "A/B Test Report" tab of the operation task details page.
# 5.2 Report Introduction
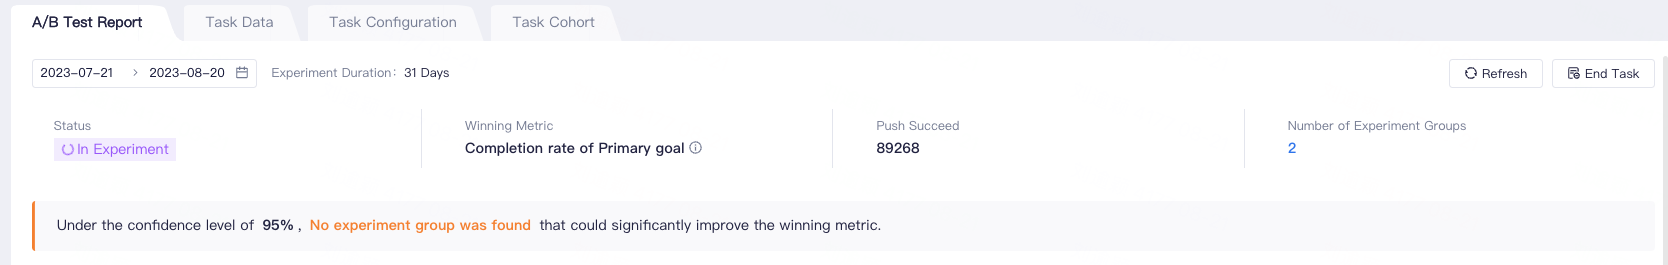
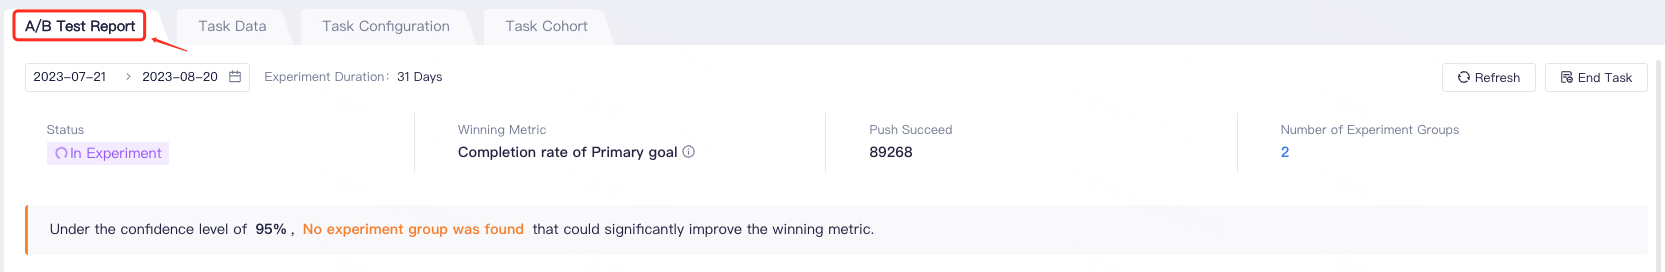
# 5.2.1 Basic Information
The basic information in the report includes the experiment duration,status, winning metric, push succeed users, and number of experiment groups.
- Experiment Duration: The time from the start of an experiment to the completion of experiement report.
- Default Start Time: The start time of the experiment.
- Default End Time: Today, you may set the end time as late as the report completion time.
- The time filter takes effect on the full experiment report, including experiment group data, winning group determination, and the line chart.
- The experiment duration cannot exceed 90 days.
- Experiment Status: to describe the current status of the A/B test. For more details, refer to the experiment status description.
- Winning Metric: the key metric for identifying the winning group in the experiment.
- Push Succeed: The total number of successfully pushed users covered by all push groups, including the control group and experiment groups, in the A/B test.
- Number of experiment Groups: The total number of control and experiment groups in the A/B test.
# 5.2.2 Experiment Statistics
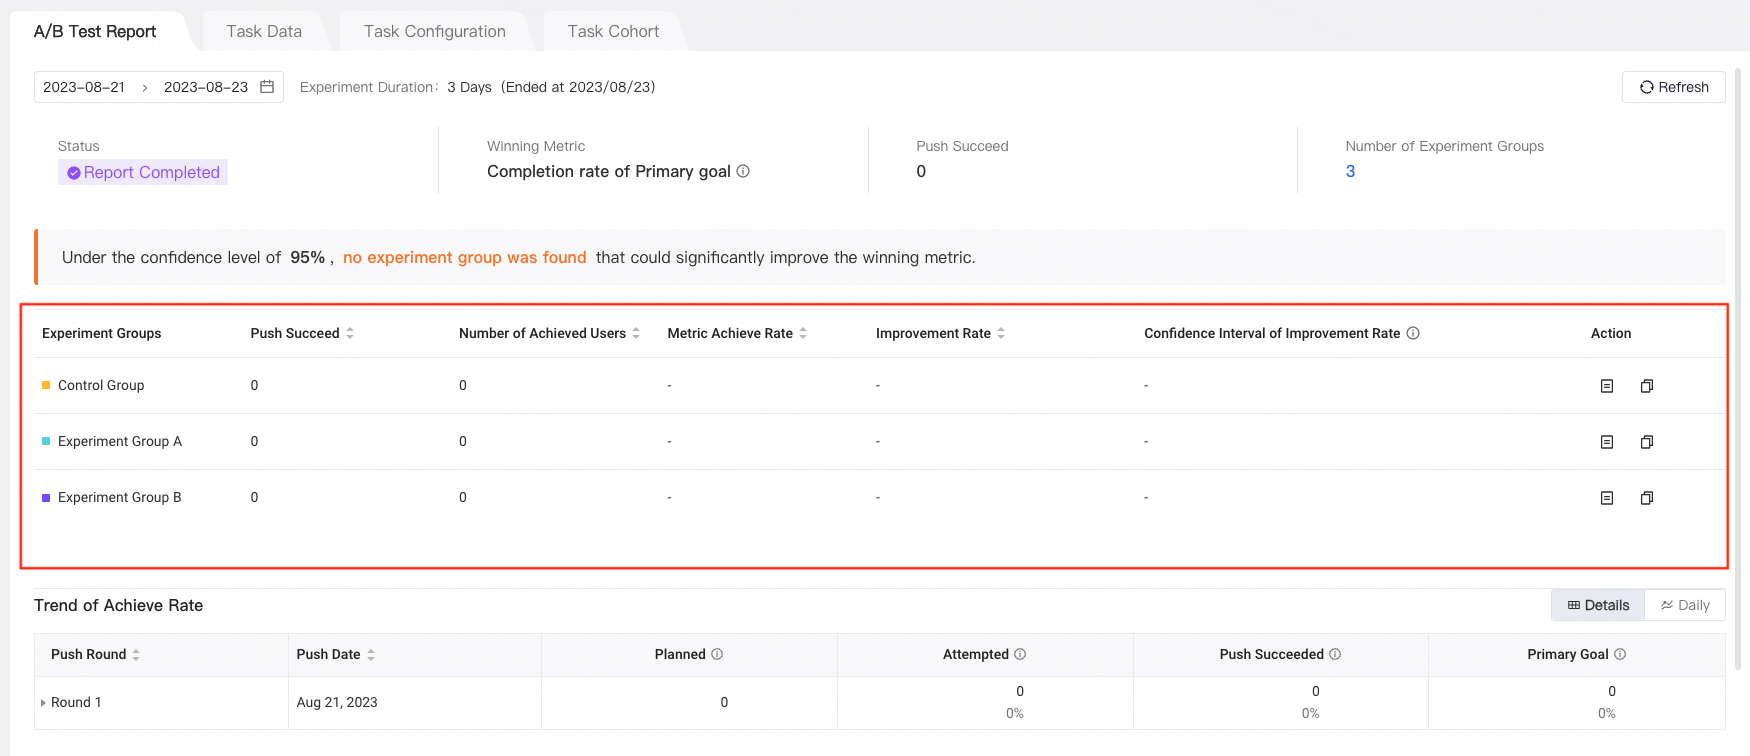
- Push Succeed: The total number of successfully pushed users for each experiment group.
- Number of Achieved Users: The number of users in each experiment group who achieved the 'winning metric'.
- Metric Achieved Rate: The ratio of Number of Achieved Users/Push Succeed.
- Improvement Rate: This rate refers to the rate of change in the experiment group's metric compared to the control group's metric.
- Experiment Winner Determination Rule: The experiment group with the highest improvement rate is determined as the winner. If there is no experiment group that significantly improves the achievement rate compared to the control group, there is no winner in the experiment.
- Confidence Interval of Improvement Rate: This refers to the range in which the true value of the improvement rate may fall. A two-sided test with a significant level of 5% is used.
Calculation Logic:
- Experiment Group Metric: M(experiment), Experiment Group Sample Size: U(experiment)
- Control Group Metric: M(control), Control Group Sample Size: U(control)
First, calculate the standard deviation for the samples of the experiment and control groups. Since it is a ratio metric:
-
-
Calculate the improvement rate and lift:
-
-
Based on the above calculations, we can obtain:
-
-
Here, 1.96 is a variable that is converted based on different confidence levels, with a default of 95% confidence level.
- Conclusion:
- If the lower limit in the experiment group is negative and the upper limit is positive: Not significant.
- If the lower limit in the experiment group is positive and the upper limit is positive: Significantly increased.
- If the lower limit in the experiment group is negative and the upper limit is negative: Significantly decreased.
- Further Actions
- Supporting viewing the push content of the experiment groups.
- When the experiment report produces a winning group, you can directly create a new operation task for pushing to all users by clicking the "Copy" button behind each group.
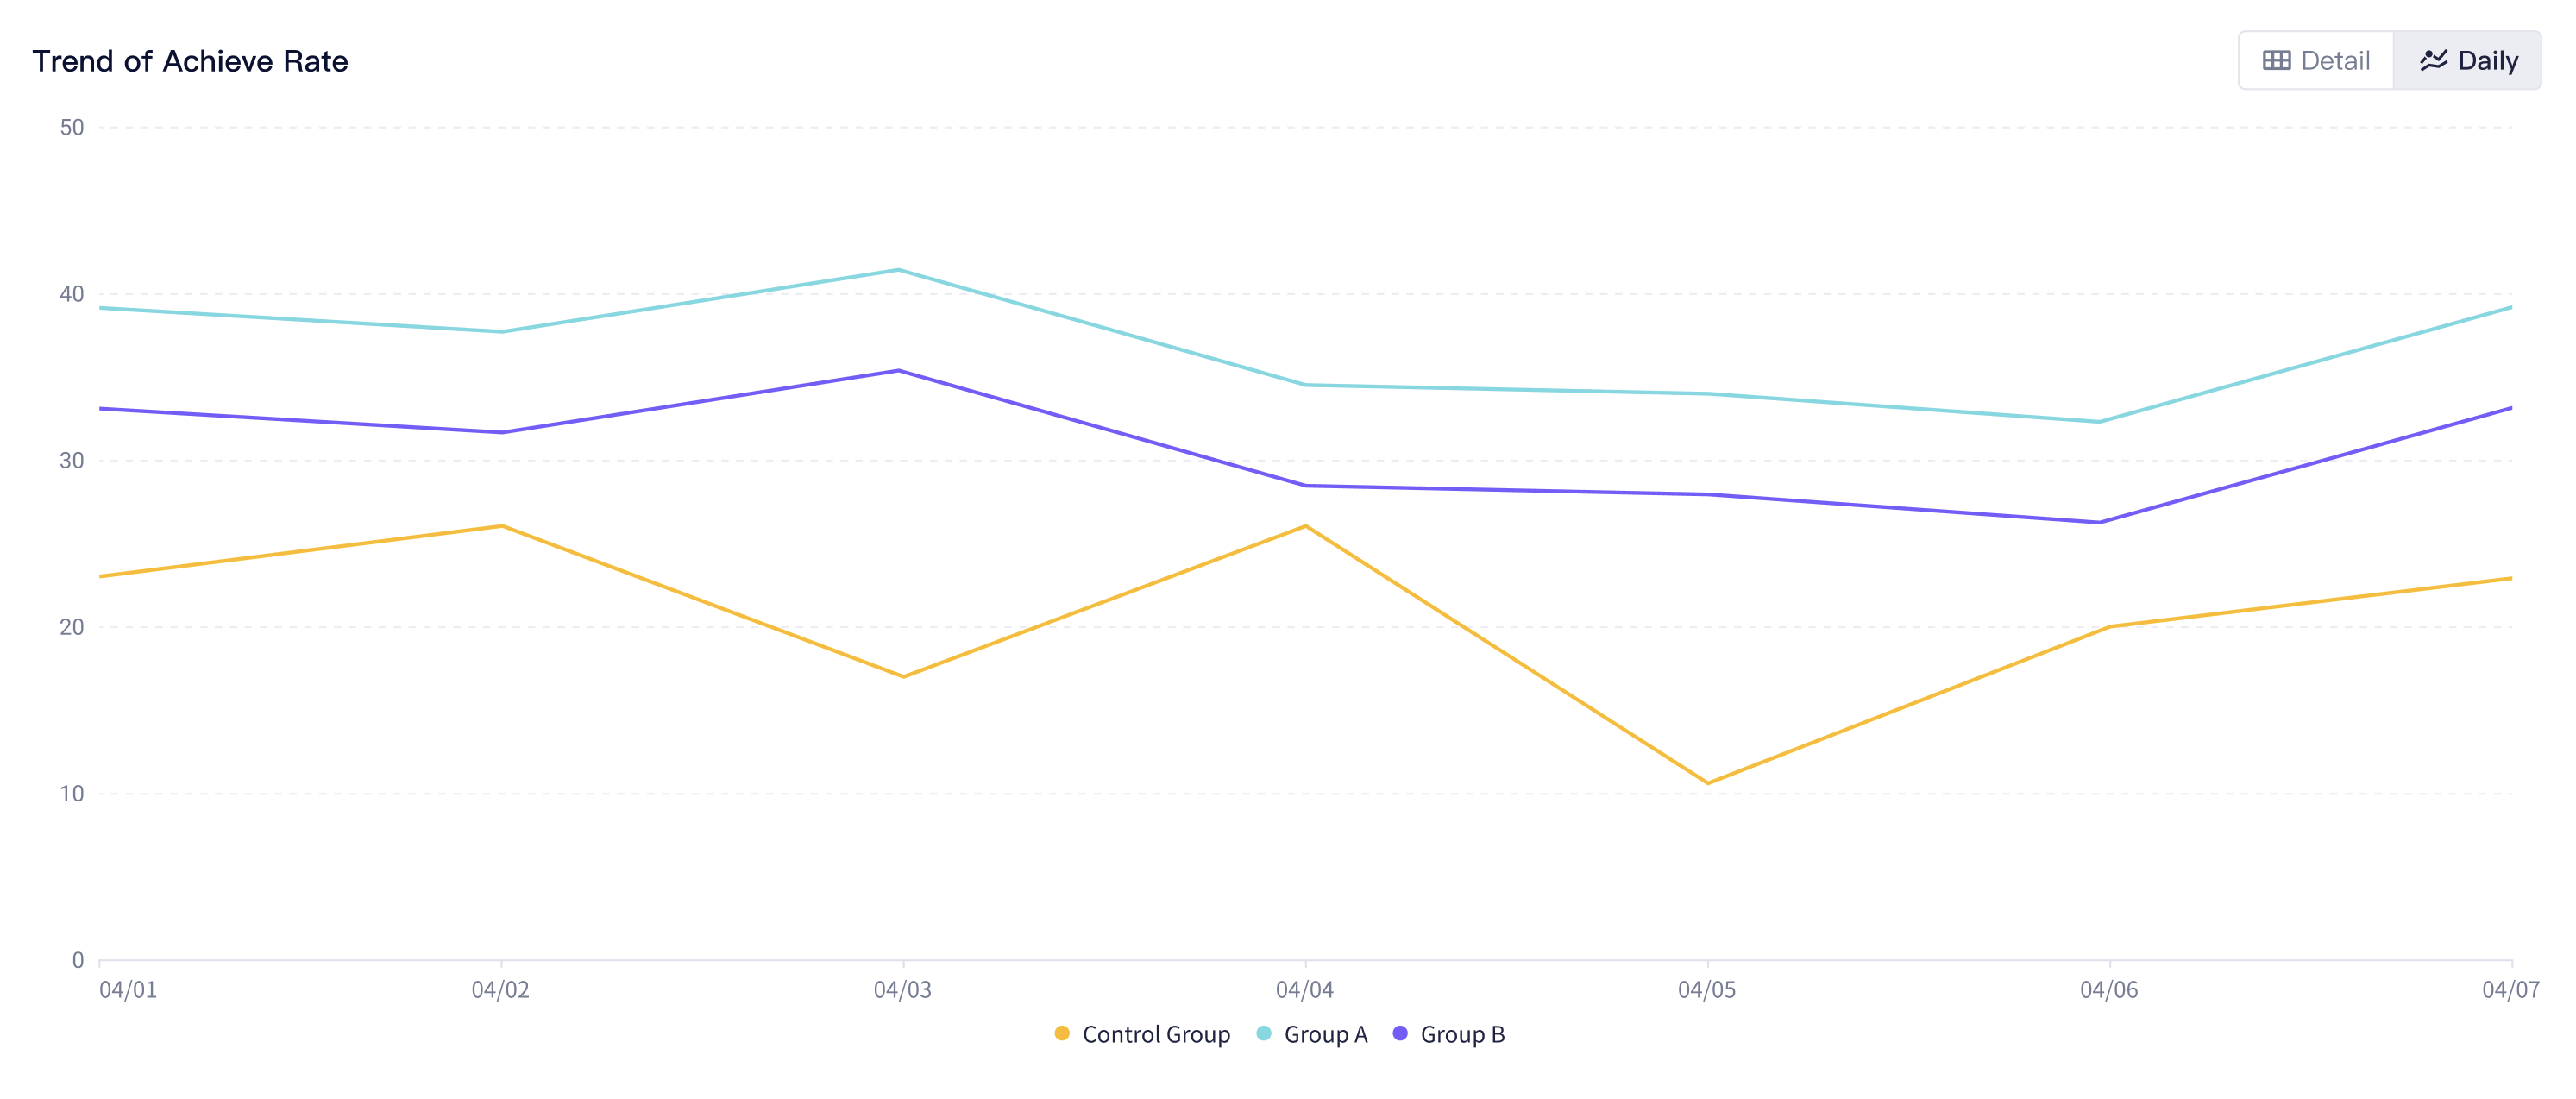
# 5.2.3 Trend of Achieve Rate
In the data details, you can see the push details and target achievement status for each experiment group from a batch perspective.
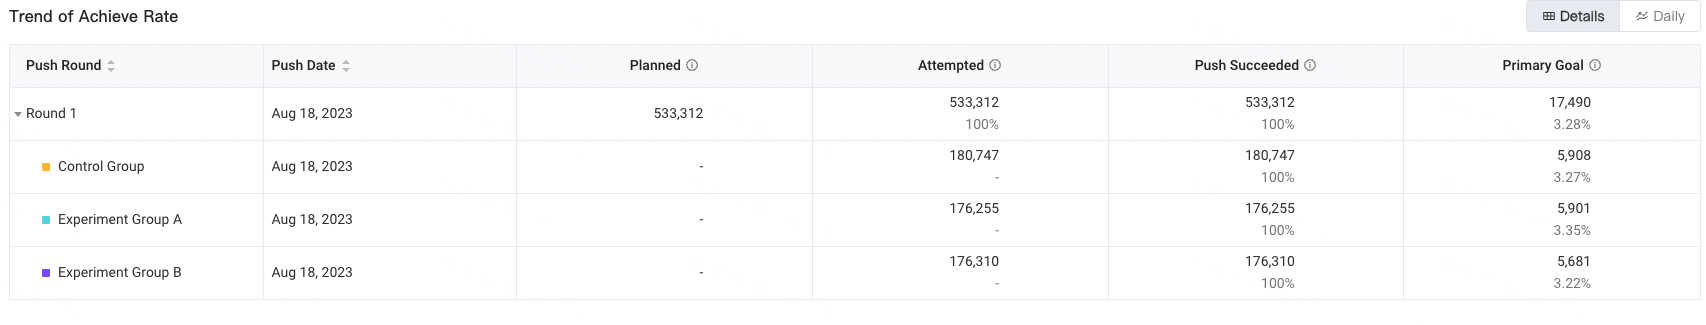
And it also supports viewing the trend chart of the achieve rate on a daily basis.
- Conclusion:
-
-
-
-
-